In the immediate post-pandemic years, states like Florida and Texas saw a massive influx of new residents as workers chased lower costs, warmer weather, and more space.
As we enter 2026, new states are emerging as real estate hot spots as Americans spread out even further across the country in search of affordability.
Driven by remote work and inflation, more Americans are moving to smaller and less traditional markets.
For the average American, this unprecedented shift has made navigating real estate trends more challenging than ever.
To help Americans understand the current landscape, Becker & Poliakoff released a study, “States With the Hottest and Coldest Real Estate Markets in 2026,” based on an analysis of eight key metrics from federal data across all 50 states and D.C. The study also identifies the hottest metro area in each state.
- Growth in home prices
- Rent
- Employment
- New home purchases
- Construction permits
- Rental vacancies
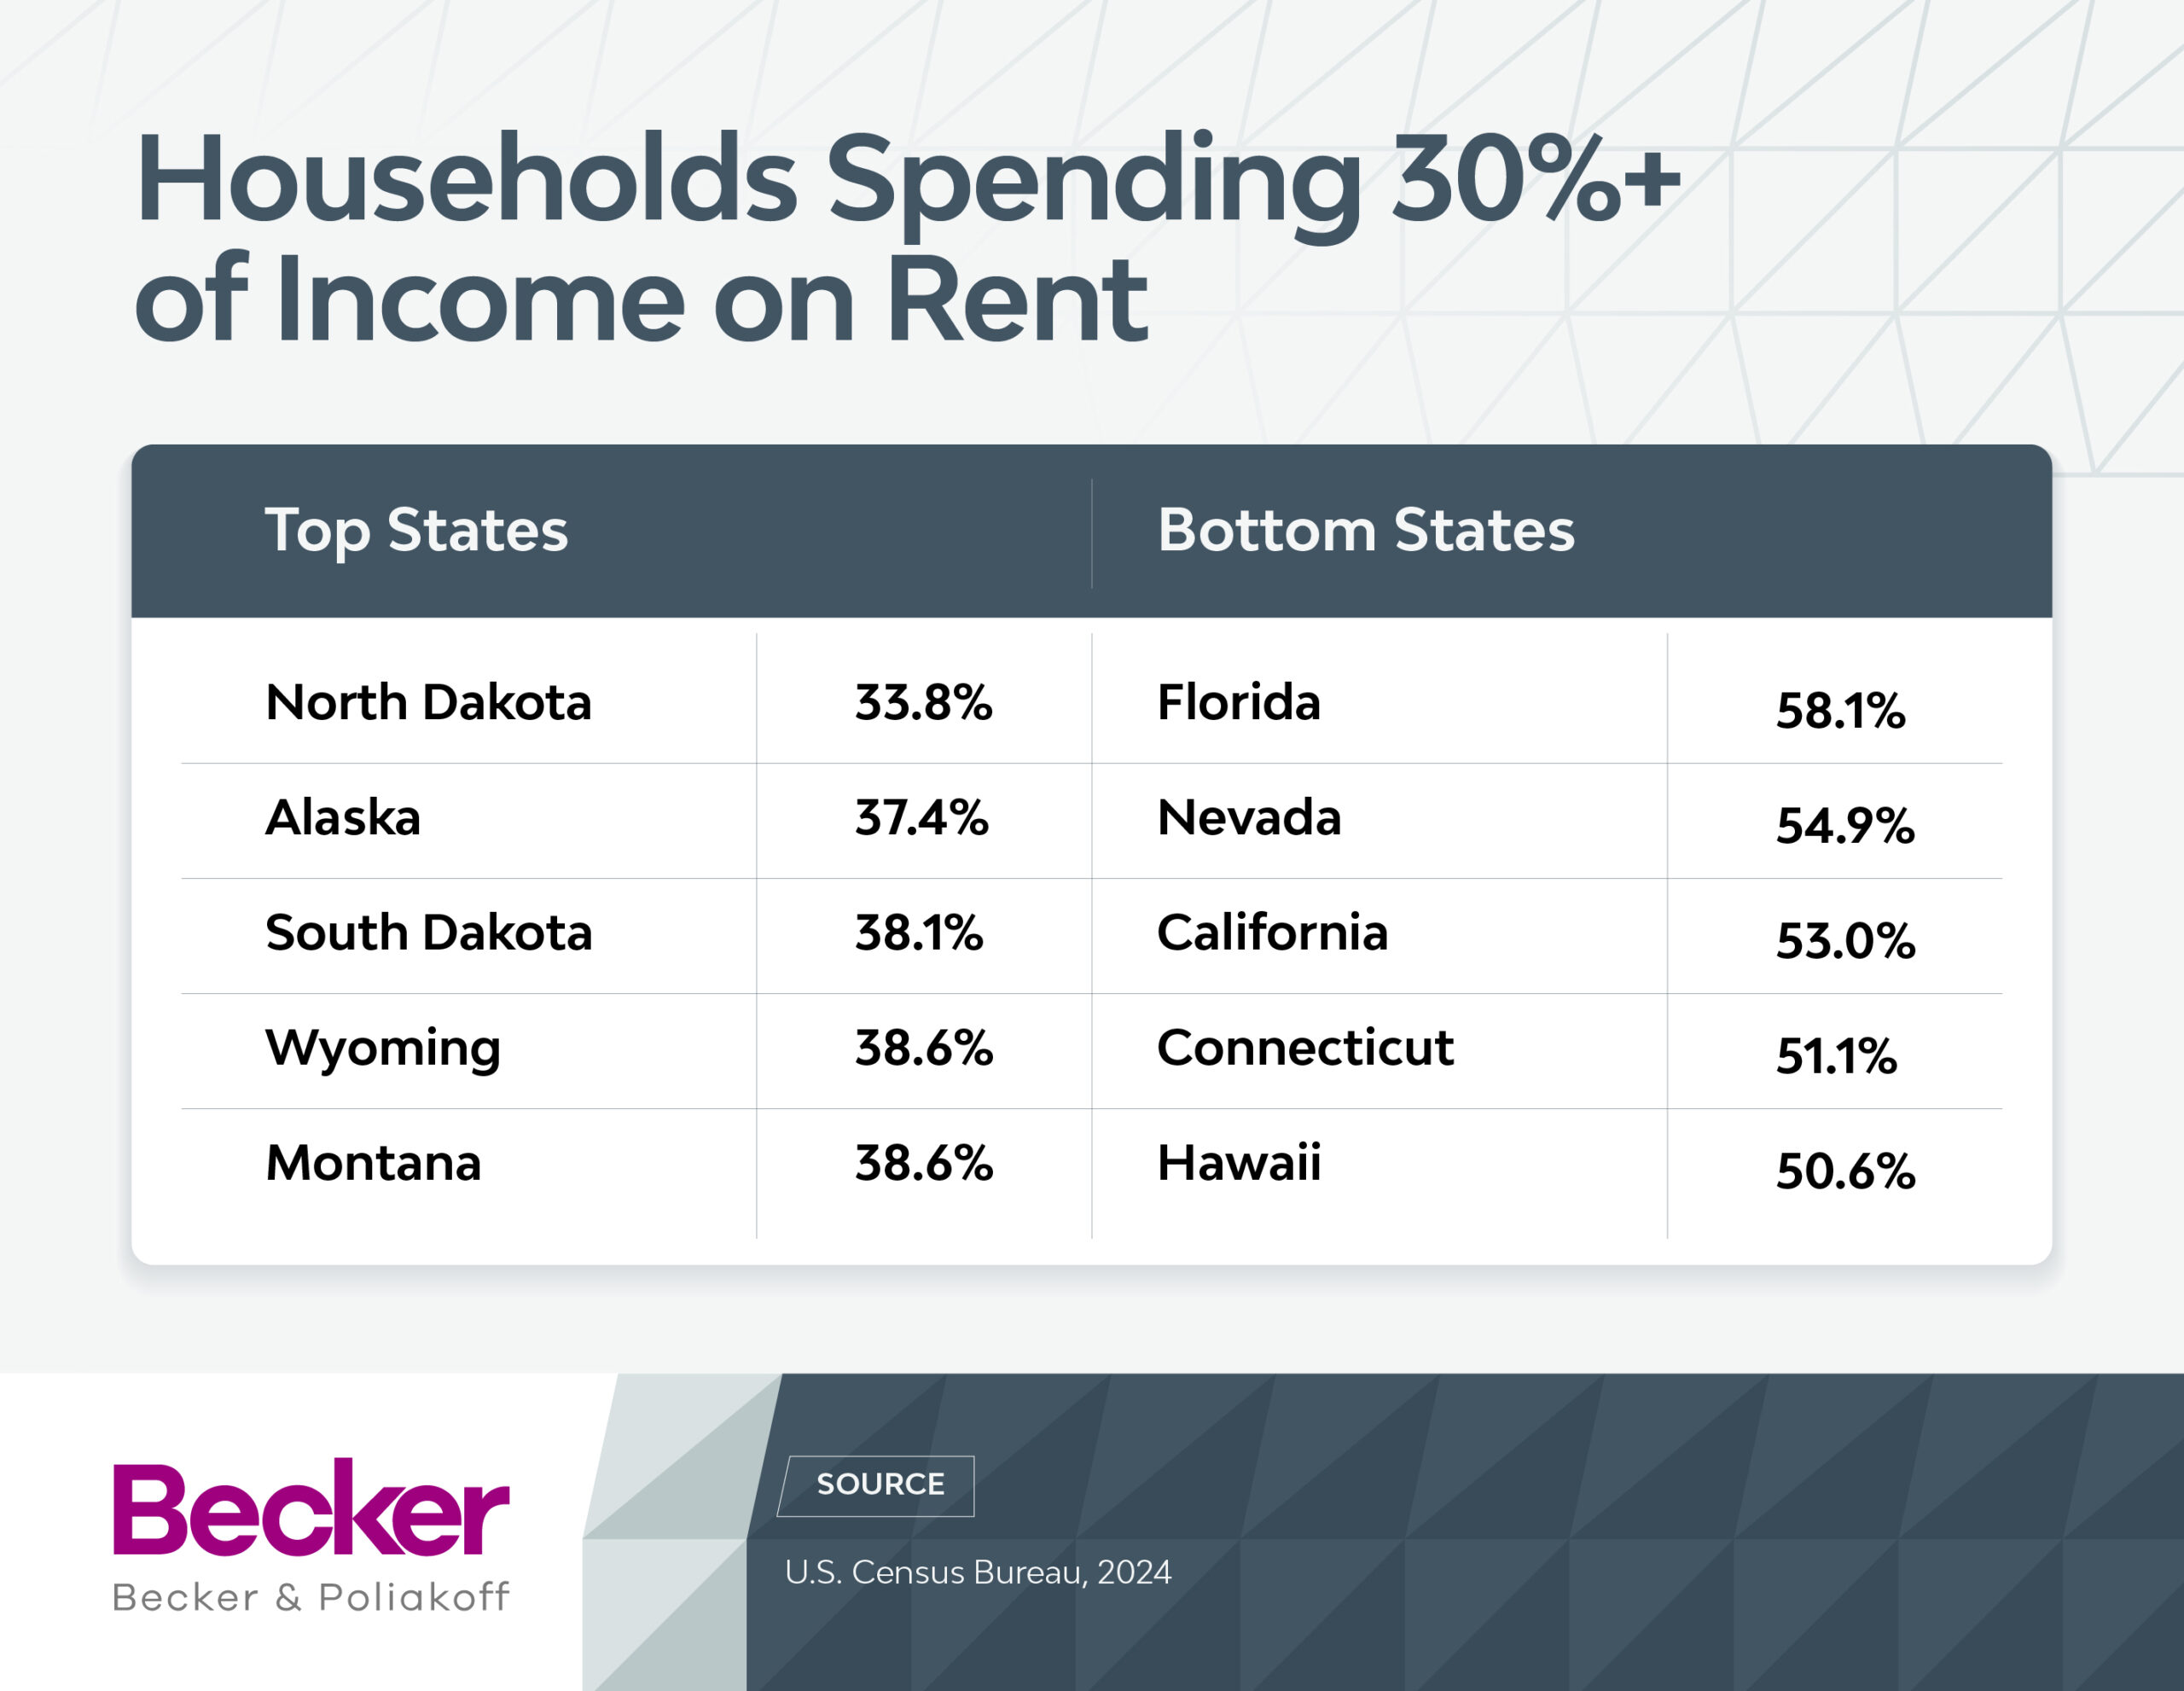
- Housing cost burden
- Population relocation
National Trends
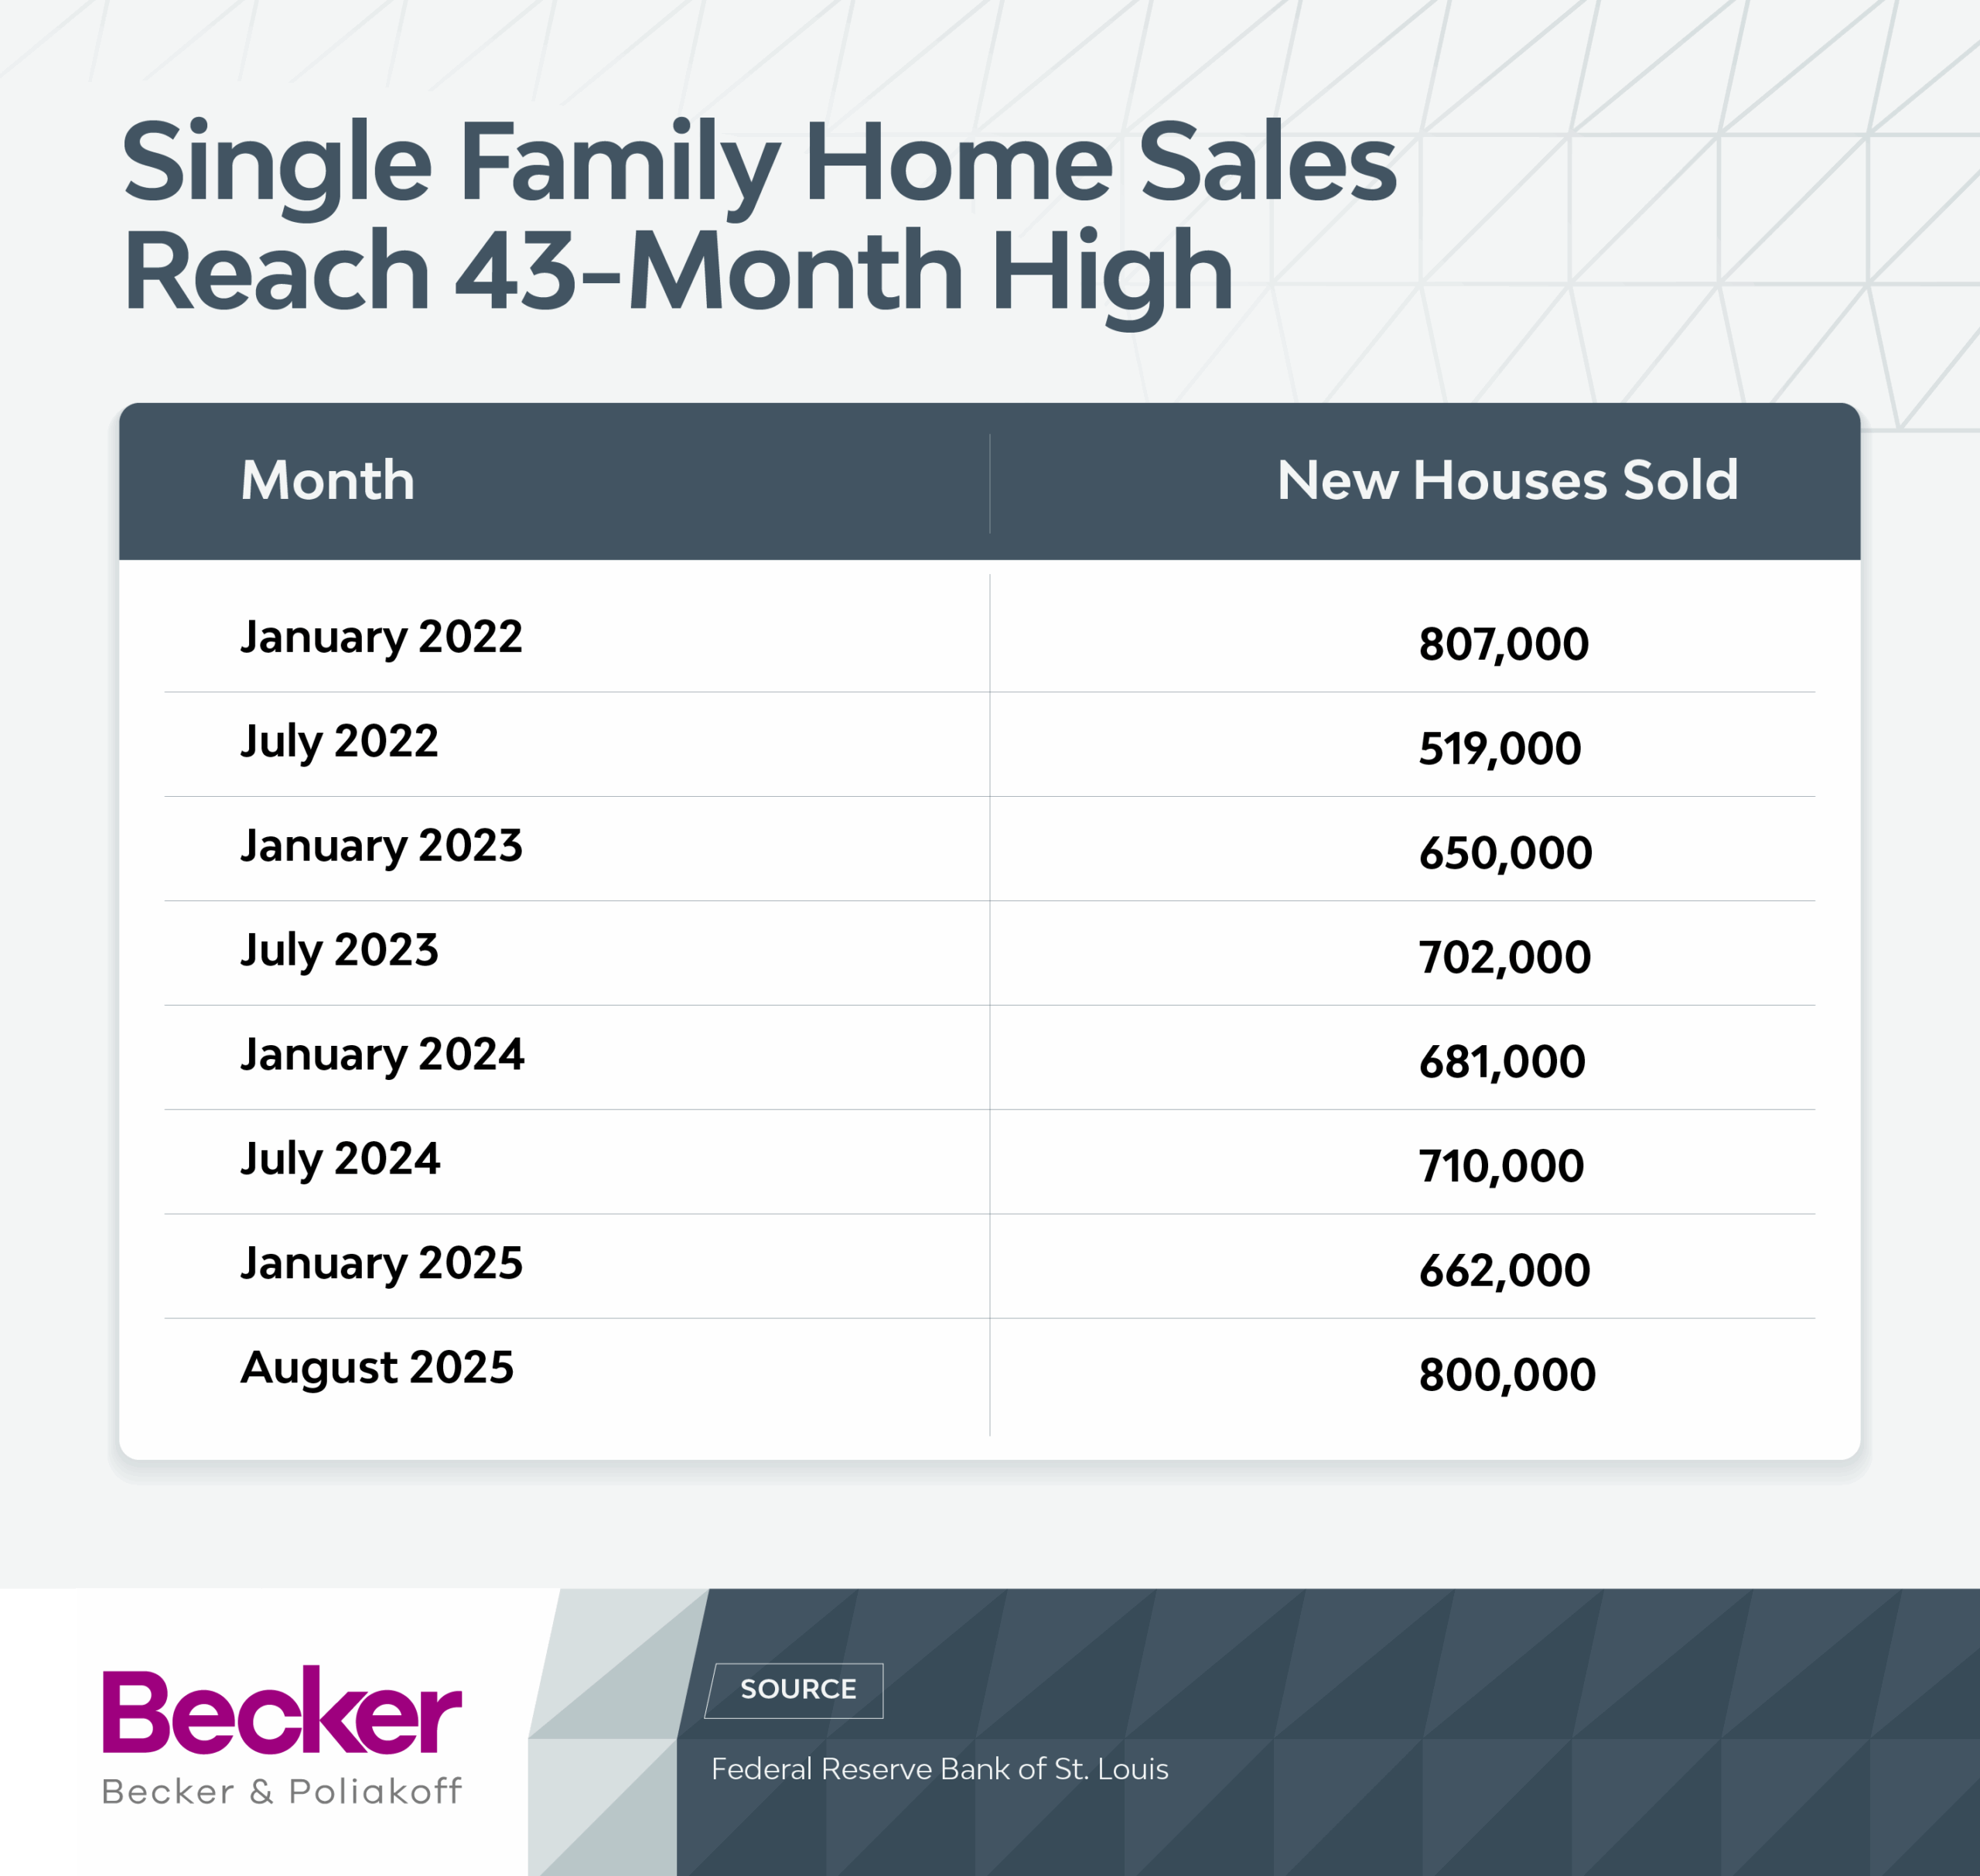
After a prolonged period of sluggish activity, buyers are finally beginning to reenter the market. Americans bought 800,000 new single-family homes in August 2025 – up 15.4% from a year earlier and the highest level since January 2022, federal data shows. That marks a 43-month high.
Still, housing remains difficult to navigate for many households. Affordability is still well below historic norms, and mortgage rates remain far higher than the near-record lows seen during the COVID-19 pandemic, according to the latest figures from the U.S. Department of Housing and Urban Development. In other words, more people may be buying, but it’s not getting any easier.
While new-home sales are climbing, existing-home sales are moving in the opposite direction. Many homeowners are stuck in a so-called “lock-in effect,” reluctant to sell because doing so would mean giving up mortgage rates often below 4% and taking on a new loan at today’s much higher market rates, currently around 6% to 7%.
At the same time, construction has slowed across both single-family and multifamily housing, keeping overall supply constrained and adding further pressure to prices.
Renters aren’t seeing much relief either. The average one-bedroom apartment now costs $1,301 per month, up from $1,042 in 2021, U.S. Census Bureau data shows.
Key Findings
- Americans are Spreading Out Beyond Post-Pandemic Hot Spots: Inflation, rising rents, and remote work are pushing households to spread out beyond post-pandemic magnets like Florida and Texas, turning unexpected markets into new hot spots.
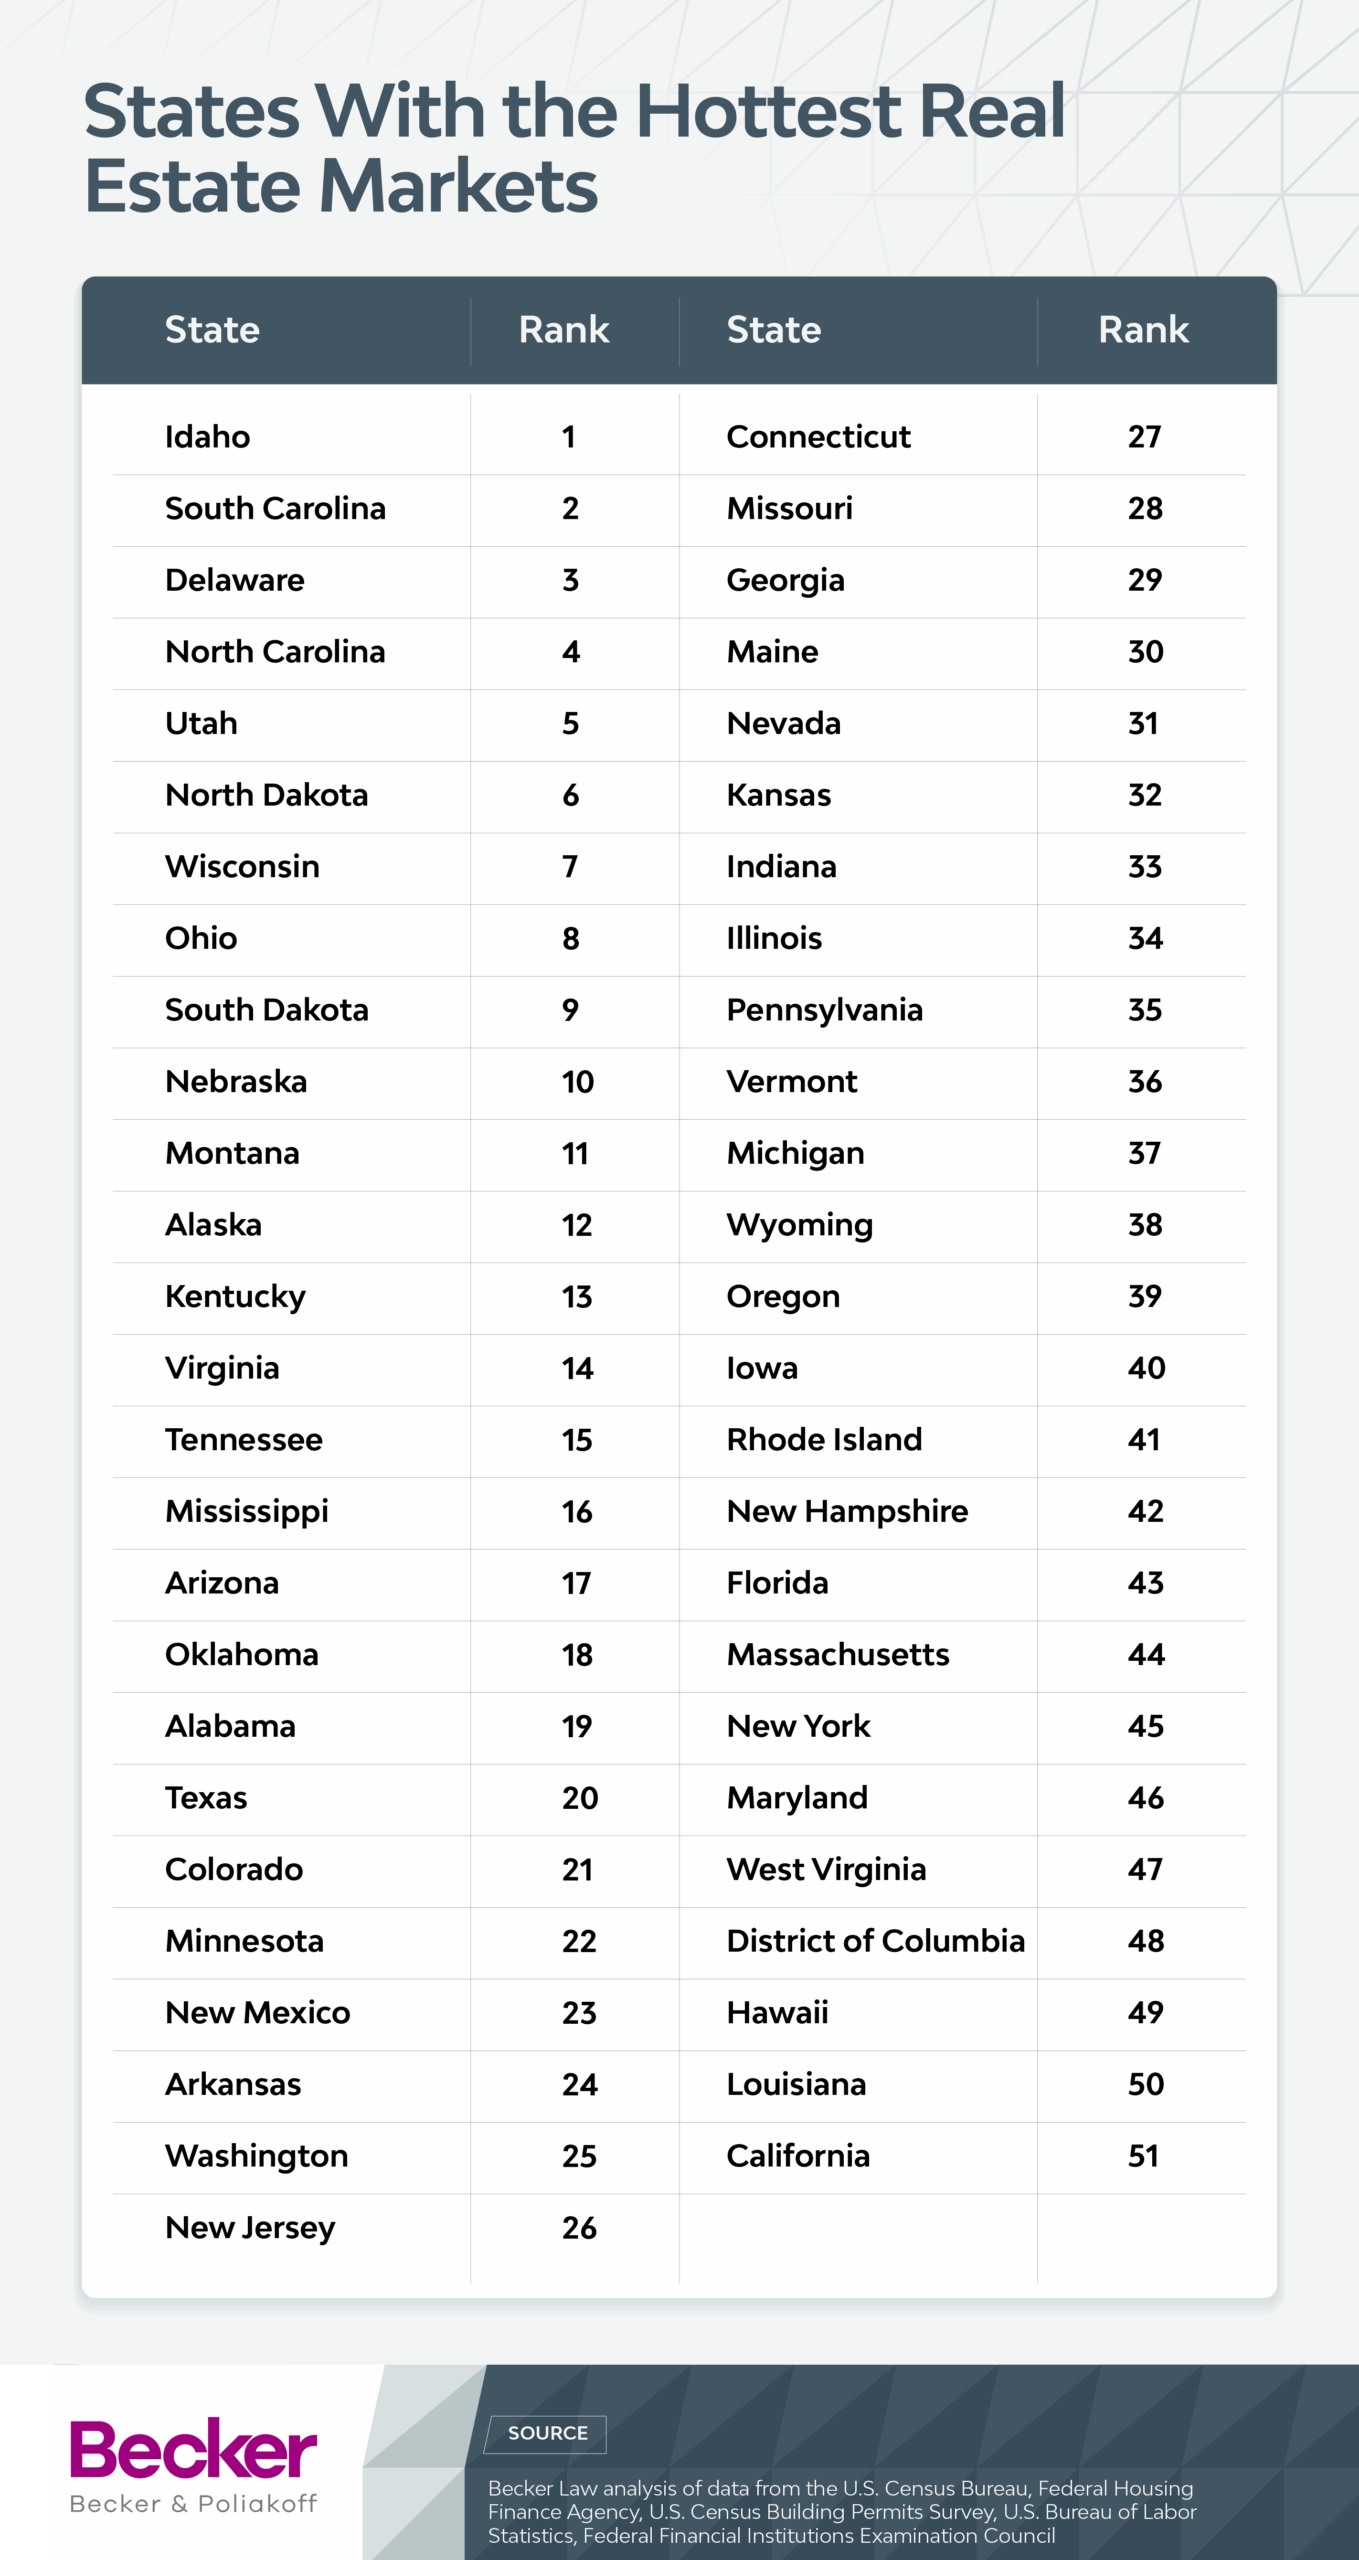
- Up-and-Coming Markets Dominate Top 10: Idaho, South Carolina, Delaware, North Carolina, Utah, North Dakota, Wisconsin, Ohio, South Dakota, and Nebraska are seeing a surge in building activity, an influx of migration, and are more affordable.
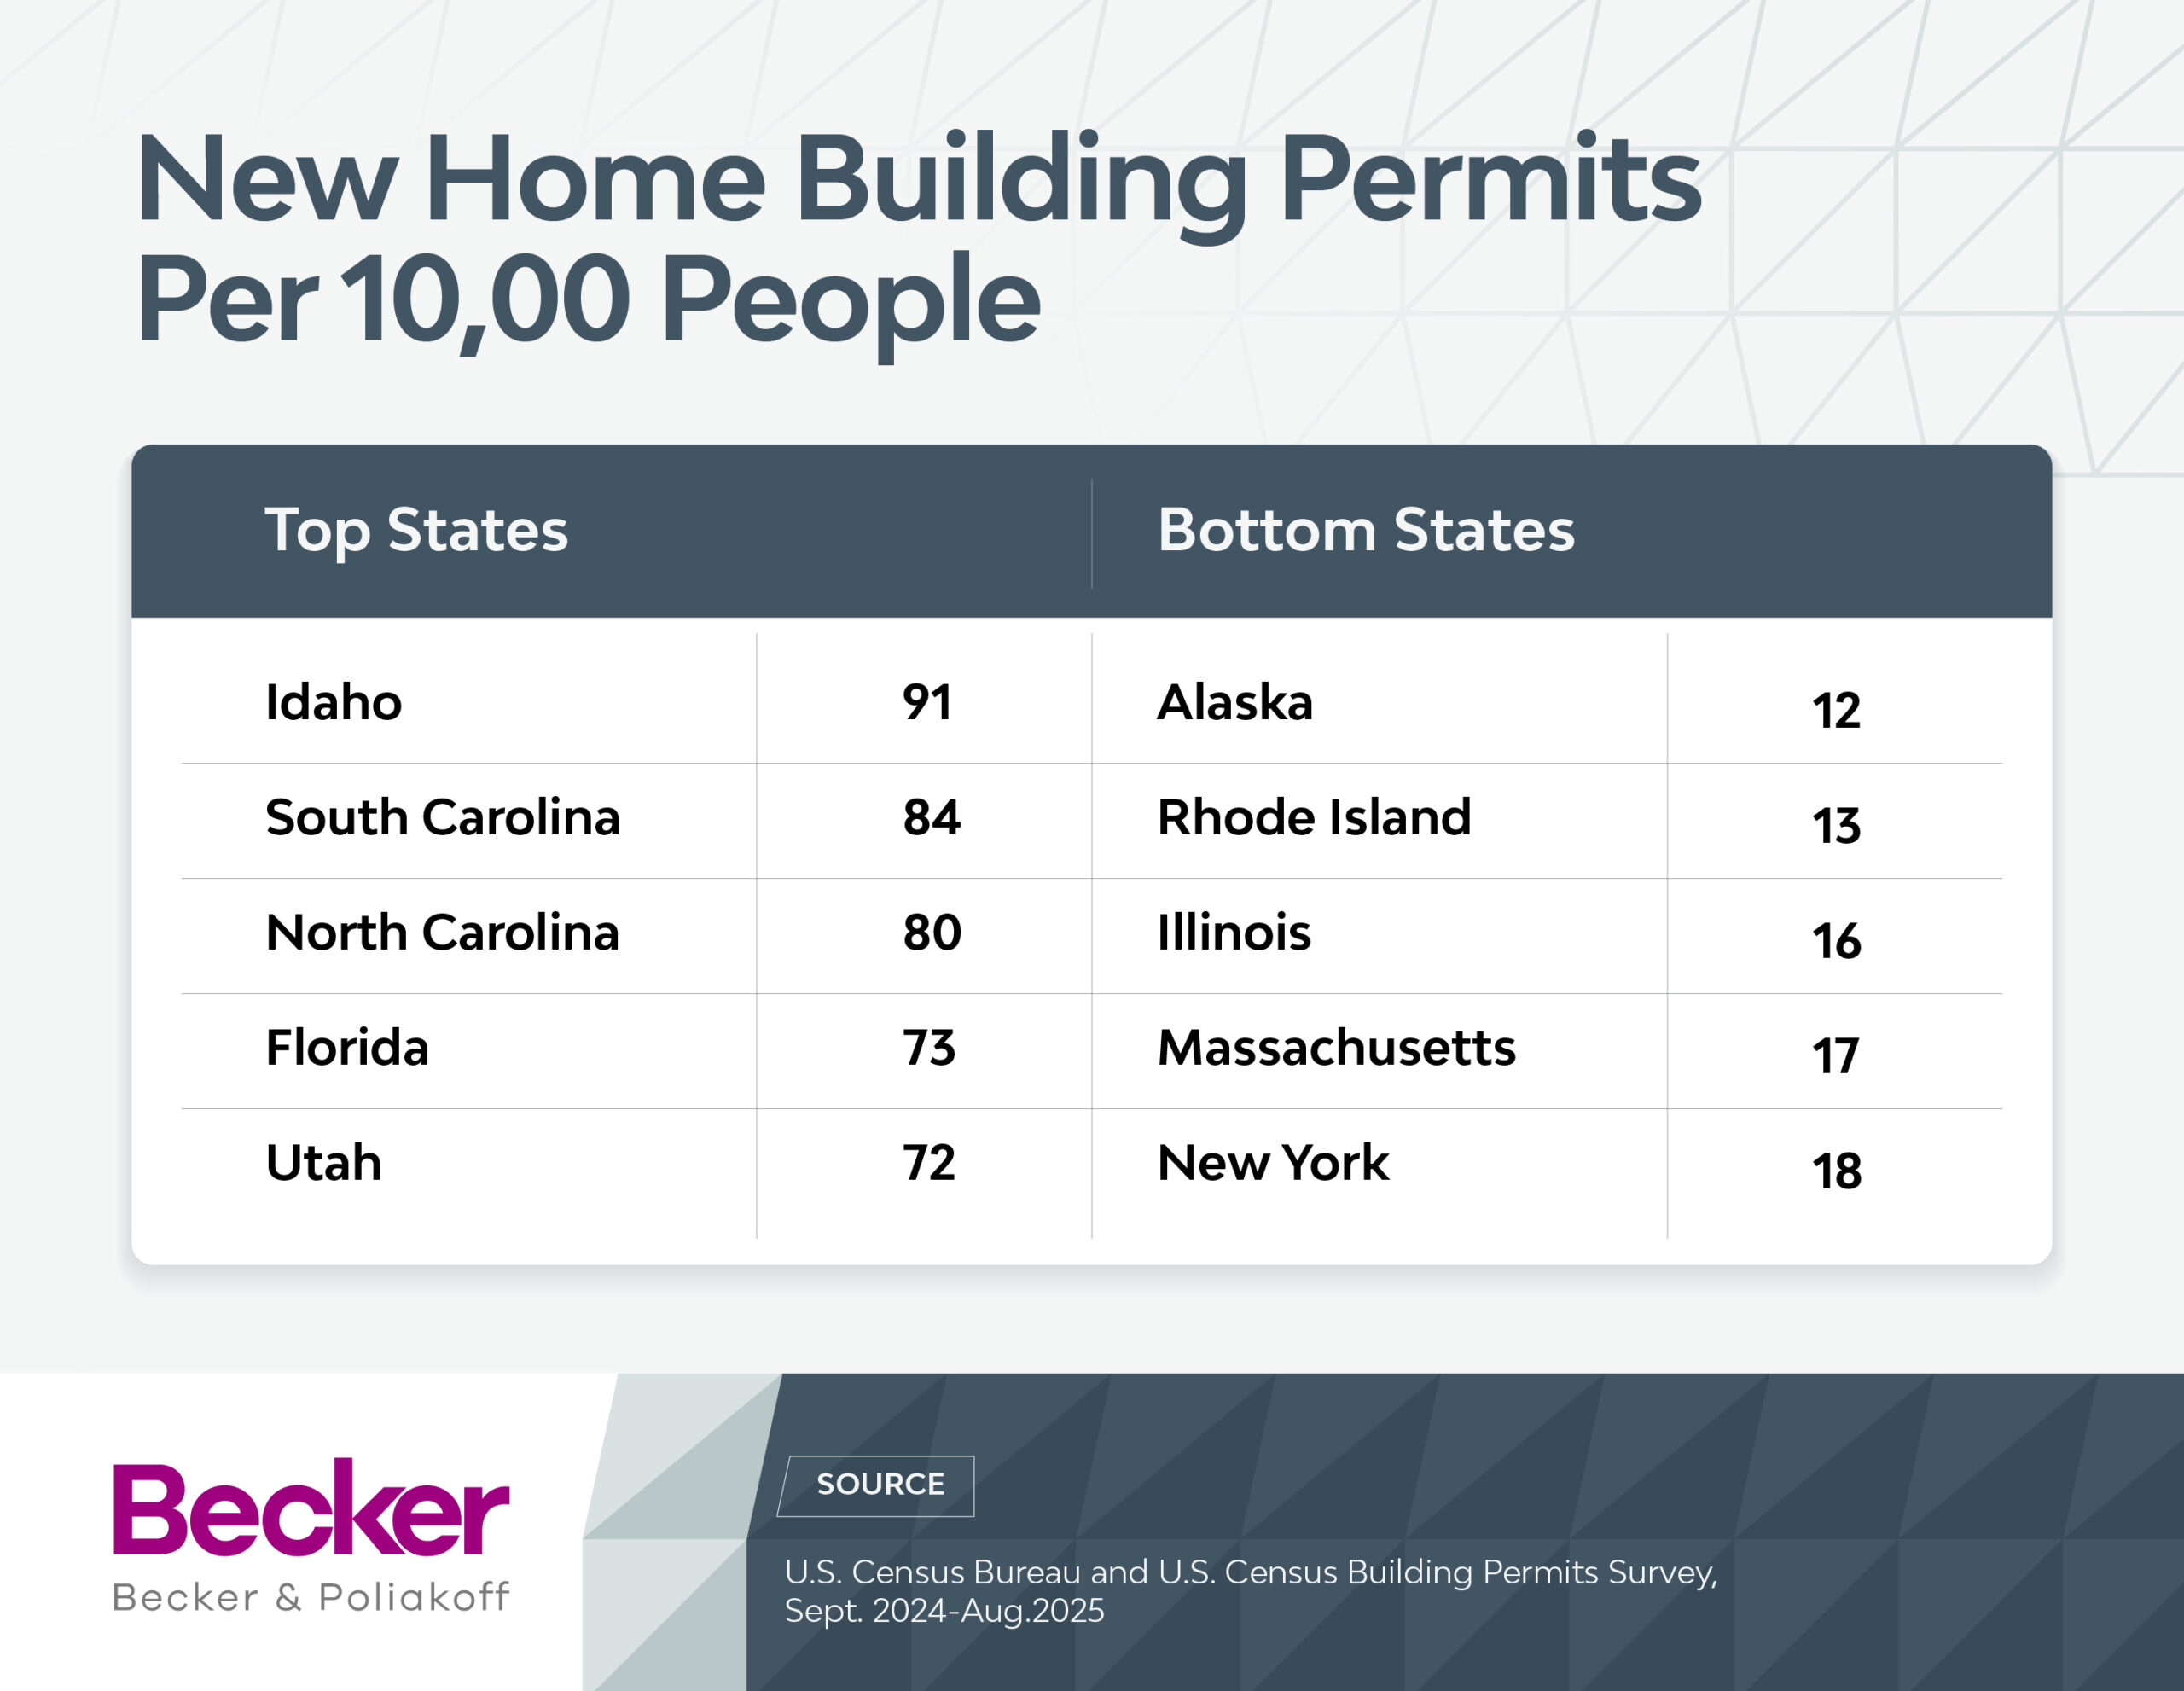
- Idaho Ranks No. 1 Hottest Real Estate Market: Idaho is a fast-moving market fueled by population growth and rising demand. There is a surge in new home construction (91 new homes per 10,000 residents), strong rent growth (10.2%), and one of the highest rates of people moving (13.7%).
- California Has the Coldest Real Estate Market: Due to slight home price declines (-0.62%), a sluggish pace of new construction (25 new homes per 10,000 residents), and a high share of cost-burdened renters (53%). This cooling likely reflects a market correction following years of exceptionally high housing costs, rather than a lack of long-term demand.
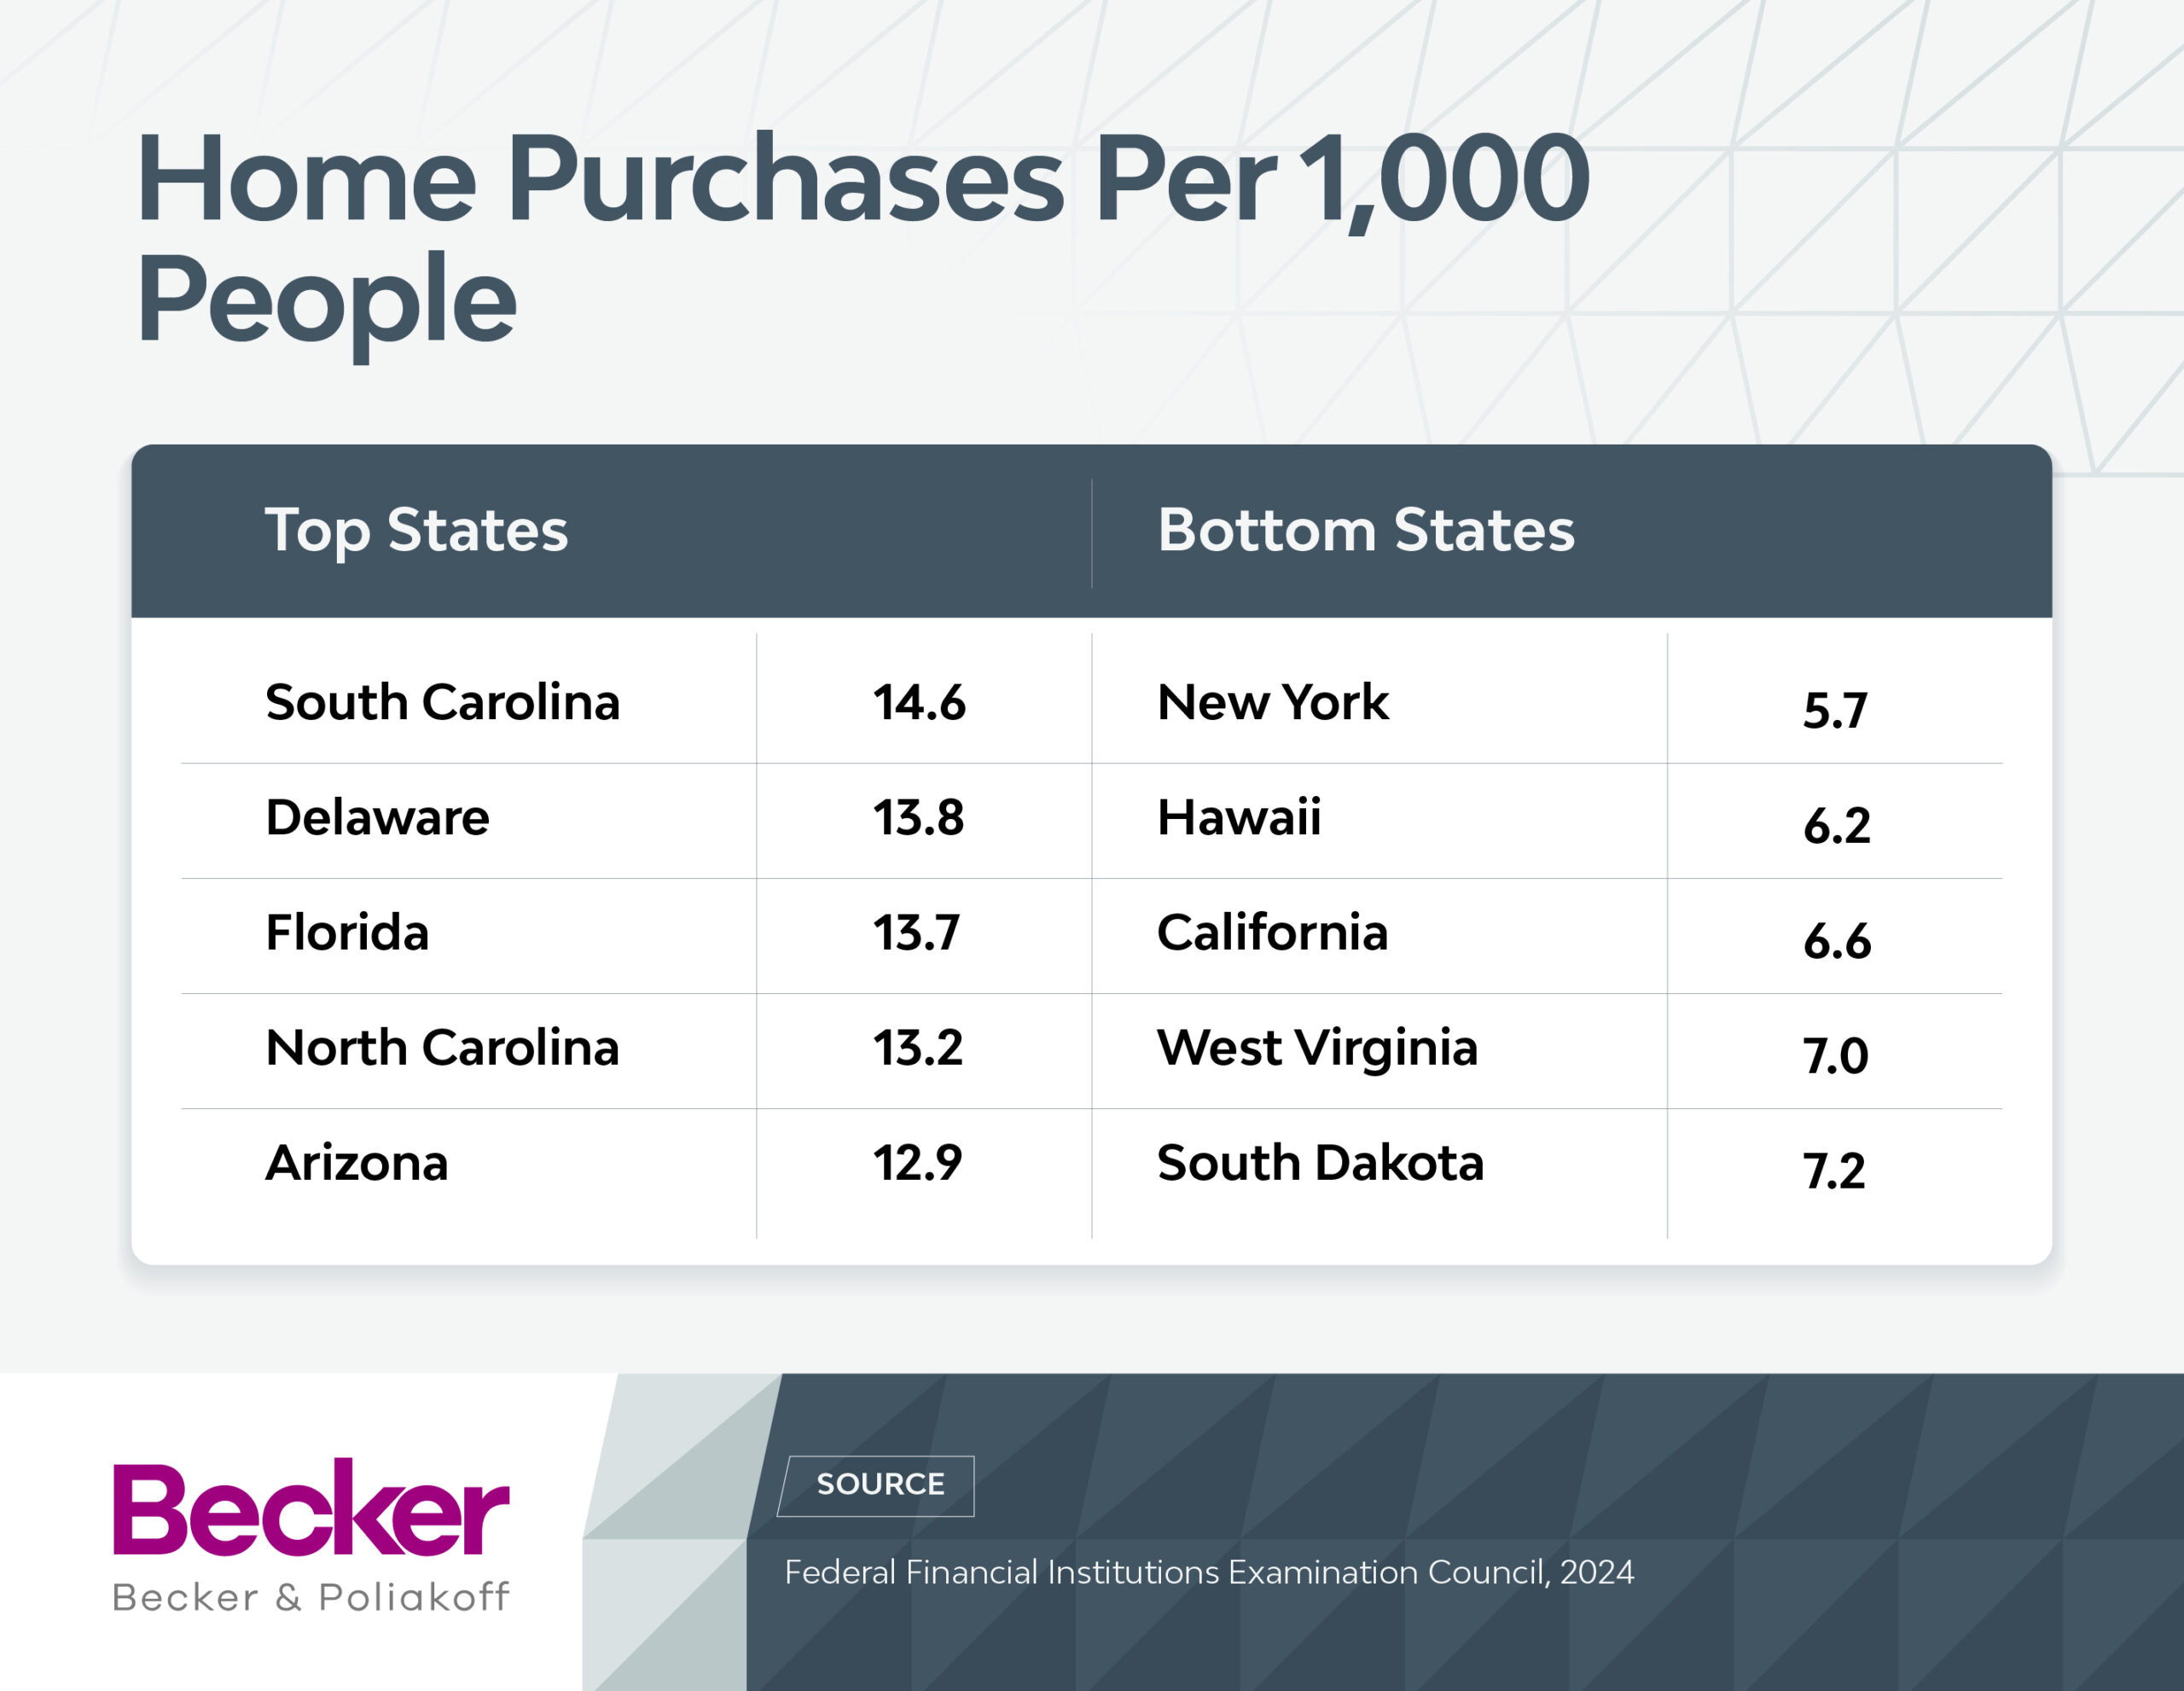
- Florida and New York Among 10 Coldest Markets: Once-booming Florida now shows signs of cooling, with home prices down 2.3% and 58.1% of renters spending more than 30% of their income on housing. New York has a limited supply and transaction activity, ranking among the lowest in new home construction (18 permits per 10,000 residents) and home purchases (5.7 per 1,000 people).
Hottest States
Idaho came out on top because its housing market has been hot yet remains relatively affordable compared to more expensive states. It has the country’s highest rate of new home builds (91 per 10,000 people) and the second-fastest-growing rents (10.2% year-over-year). Meanwhile, 13.7% of people moved in the past year, and employment grew 1.5%, both of which signal strong demand and growth in Idaho’s real estate market.
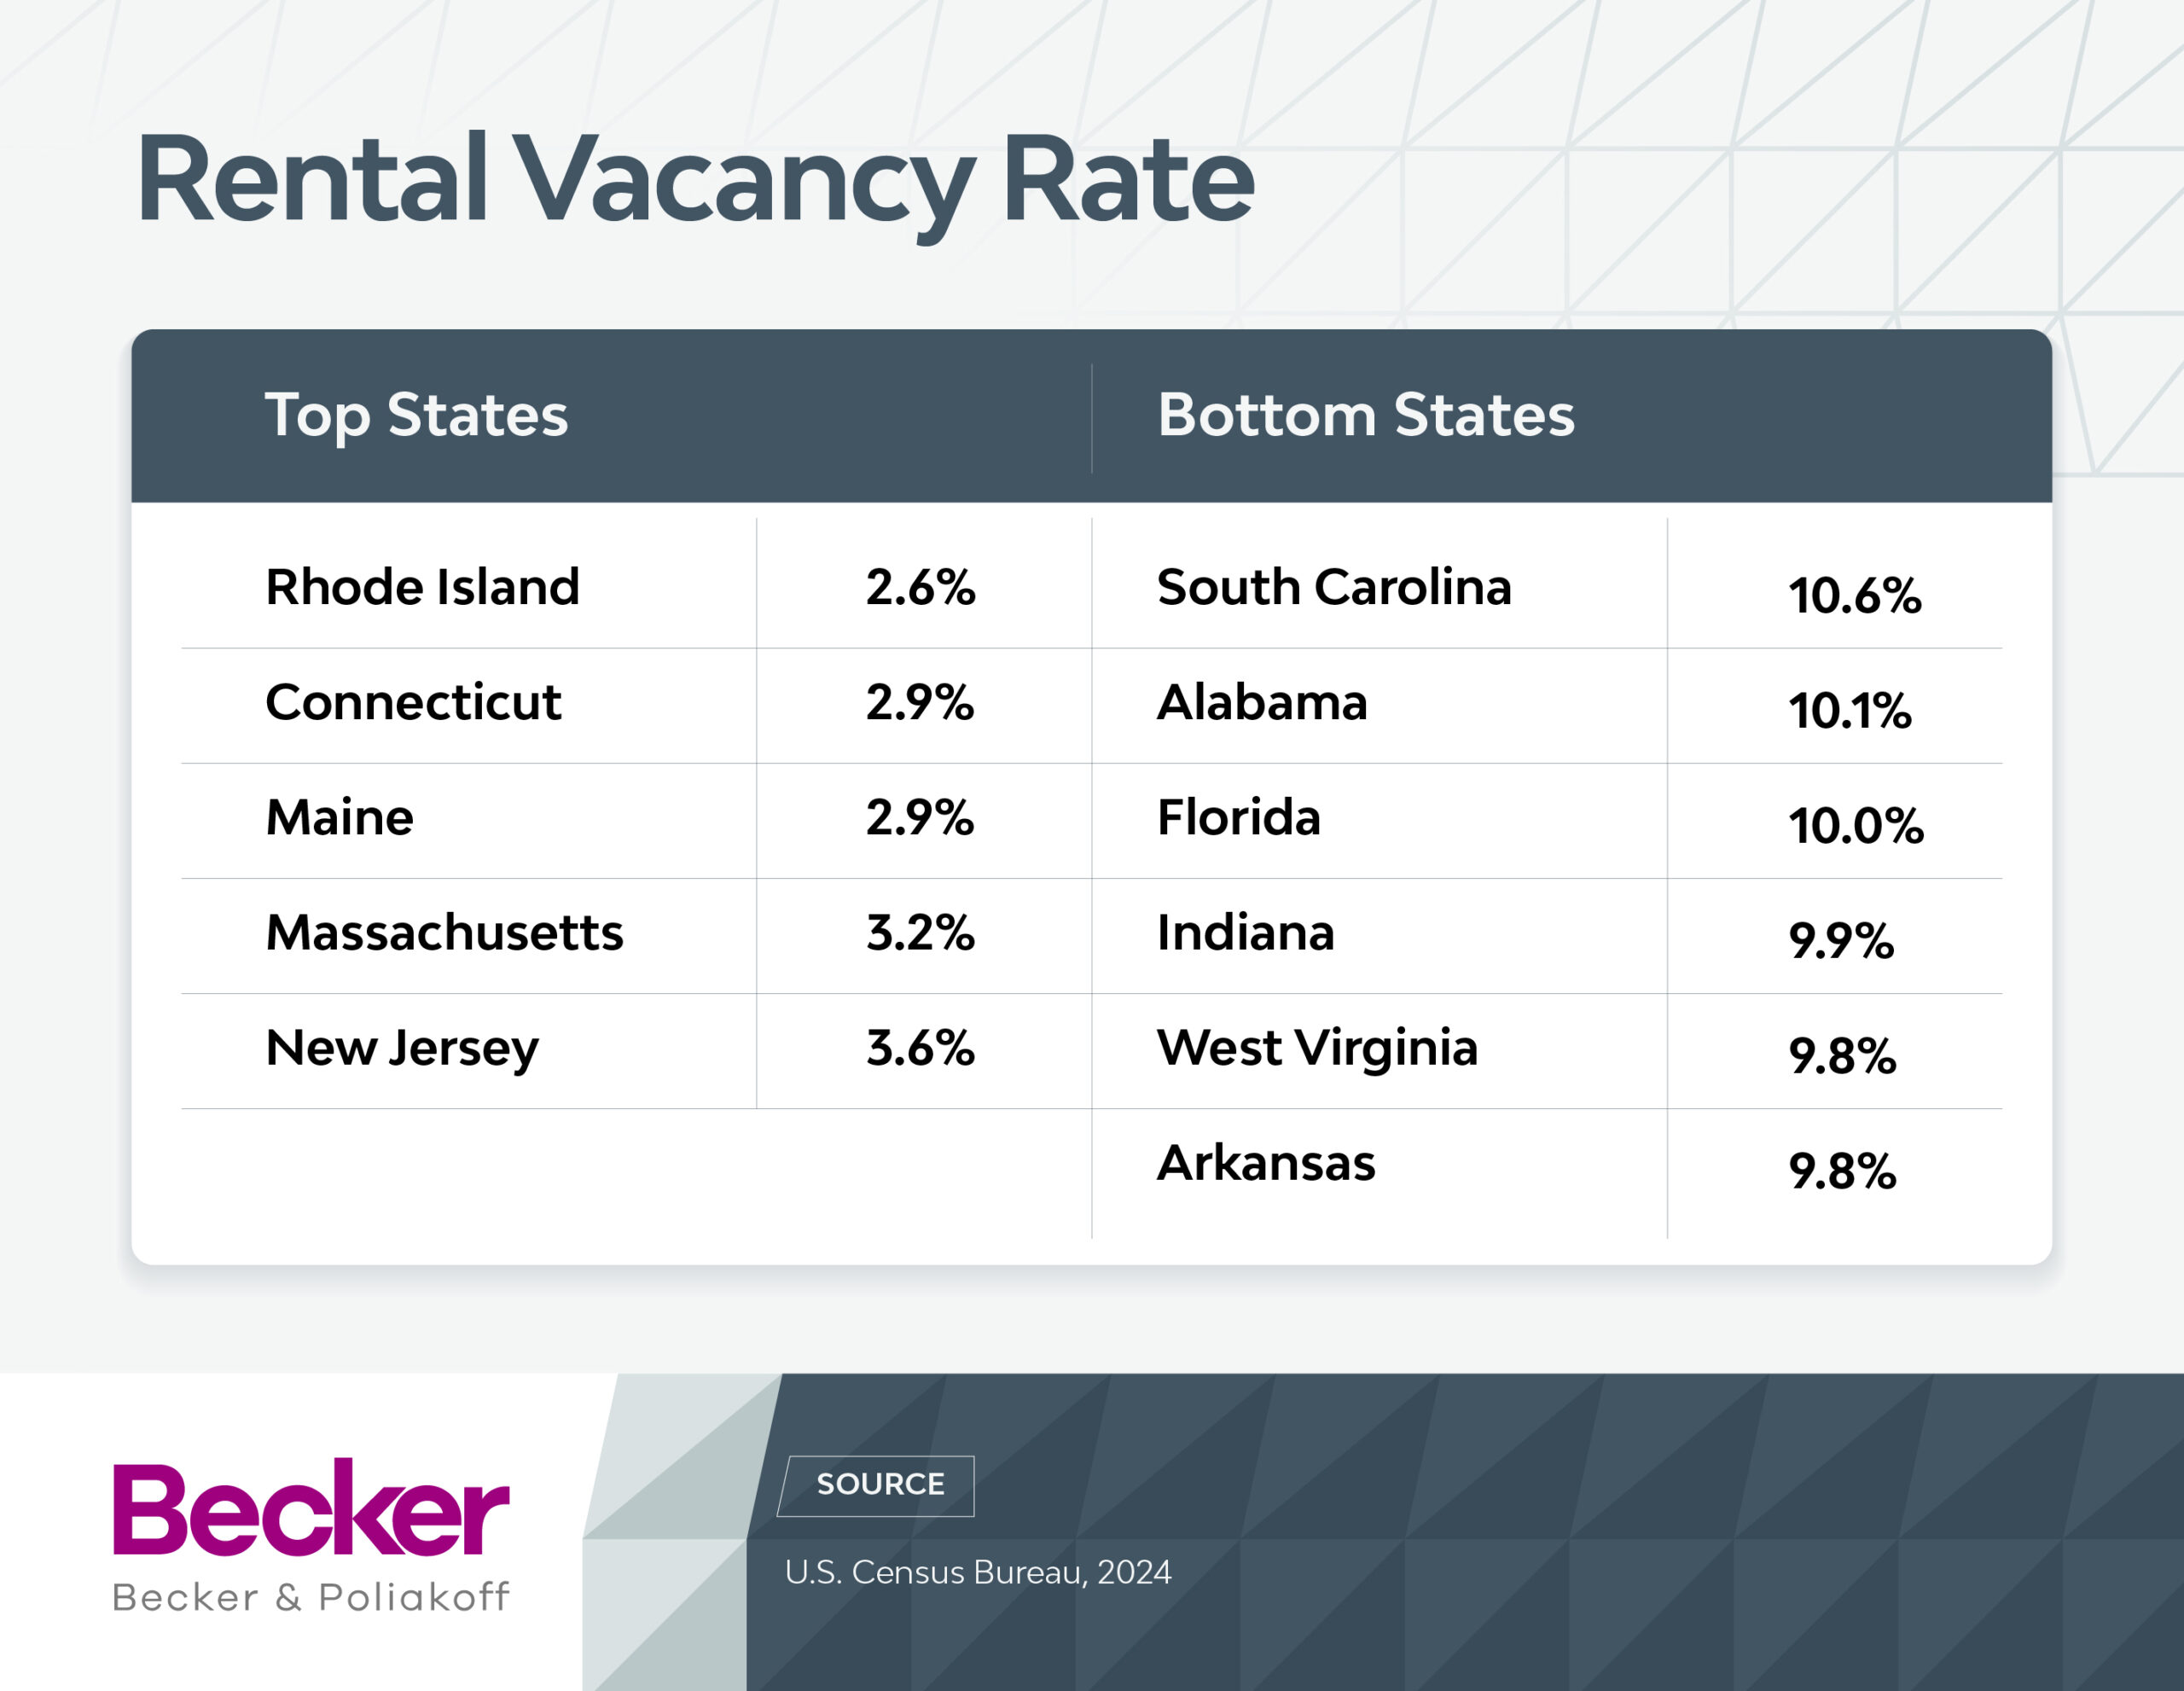
South Carolina, Delaware, North Carolina, and Utah also ranked among the top five, driven by high rates of new-home purchases, construction, and rent increases. Notably, No. 2 South Carolina has the country’s highest rental vacancy rate at 10.6%, which could signal a looming shift in the market.
Coldest States
While California is a traditional housing hotspot, it landed at the bottom overall because the ranking rewards affordability, growth, and market activity. Some cooling in California’s home prices (-0.62% year-over-year) may reflect a correction after years of rapid appreciation, but the state’s historically high costs and interest rates are keeping many people from buying.
Several additional factors weighed on California’s ranking. New home construction remains limited, with just 25 building permits issued per 10,000 people. Residential mobility is also low, with only 10.4% of residents moving in 2024. At the same time, financial pressures on households are intense: 53% of renters are cost-burdened, and employment growth reached just 0.4% over the past year.
The bottom five also include Louisiana, Hawaii, Washington, D.C., and West Virginia. They were weighed down by lagging new-home construction and purchases, as well as above-average rental vacancy rates.
Interactive Map: Click to View State-Level Data
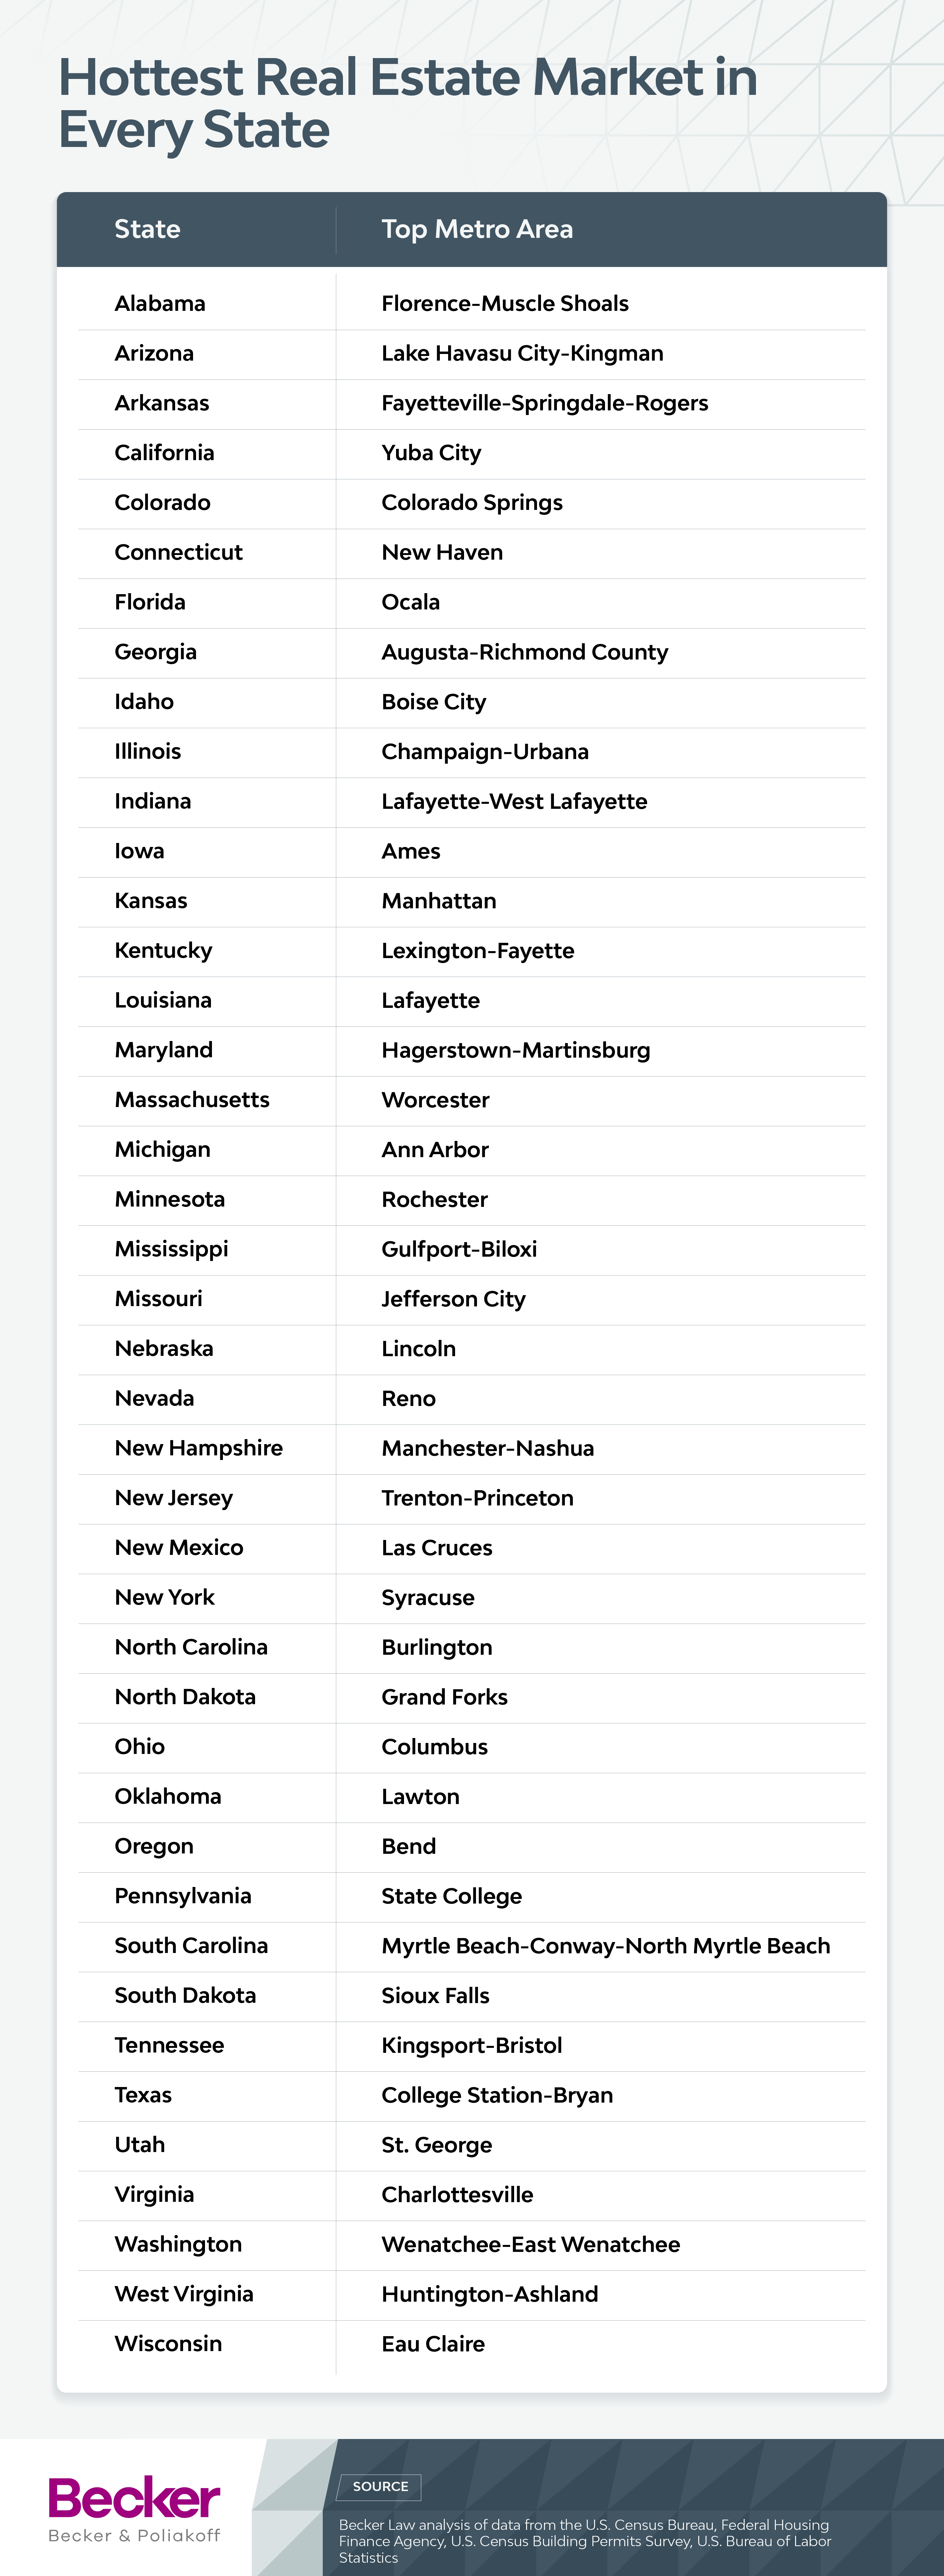
Hottest City in Every State
We analyzed metro areas nationwide to identify the hottest real estate markets in each state, using the same criteria used in our state-level rankings. To keep comparisons meaningful, we excluded states with only one relevant metro area: Alaska, Delaware, Hawaii, Maine, Montana, Rhode Island, Vermont, Wyoming, and Washington, D.C.
For a deeper dive into how we analyzed the numbers, see the full methodology at the bottom of the page.
Top and Bottom Cities by Metric
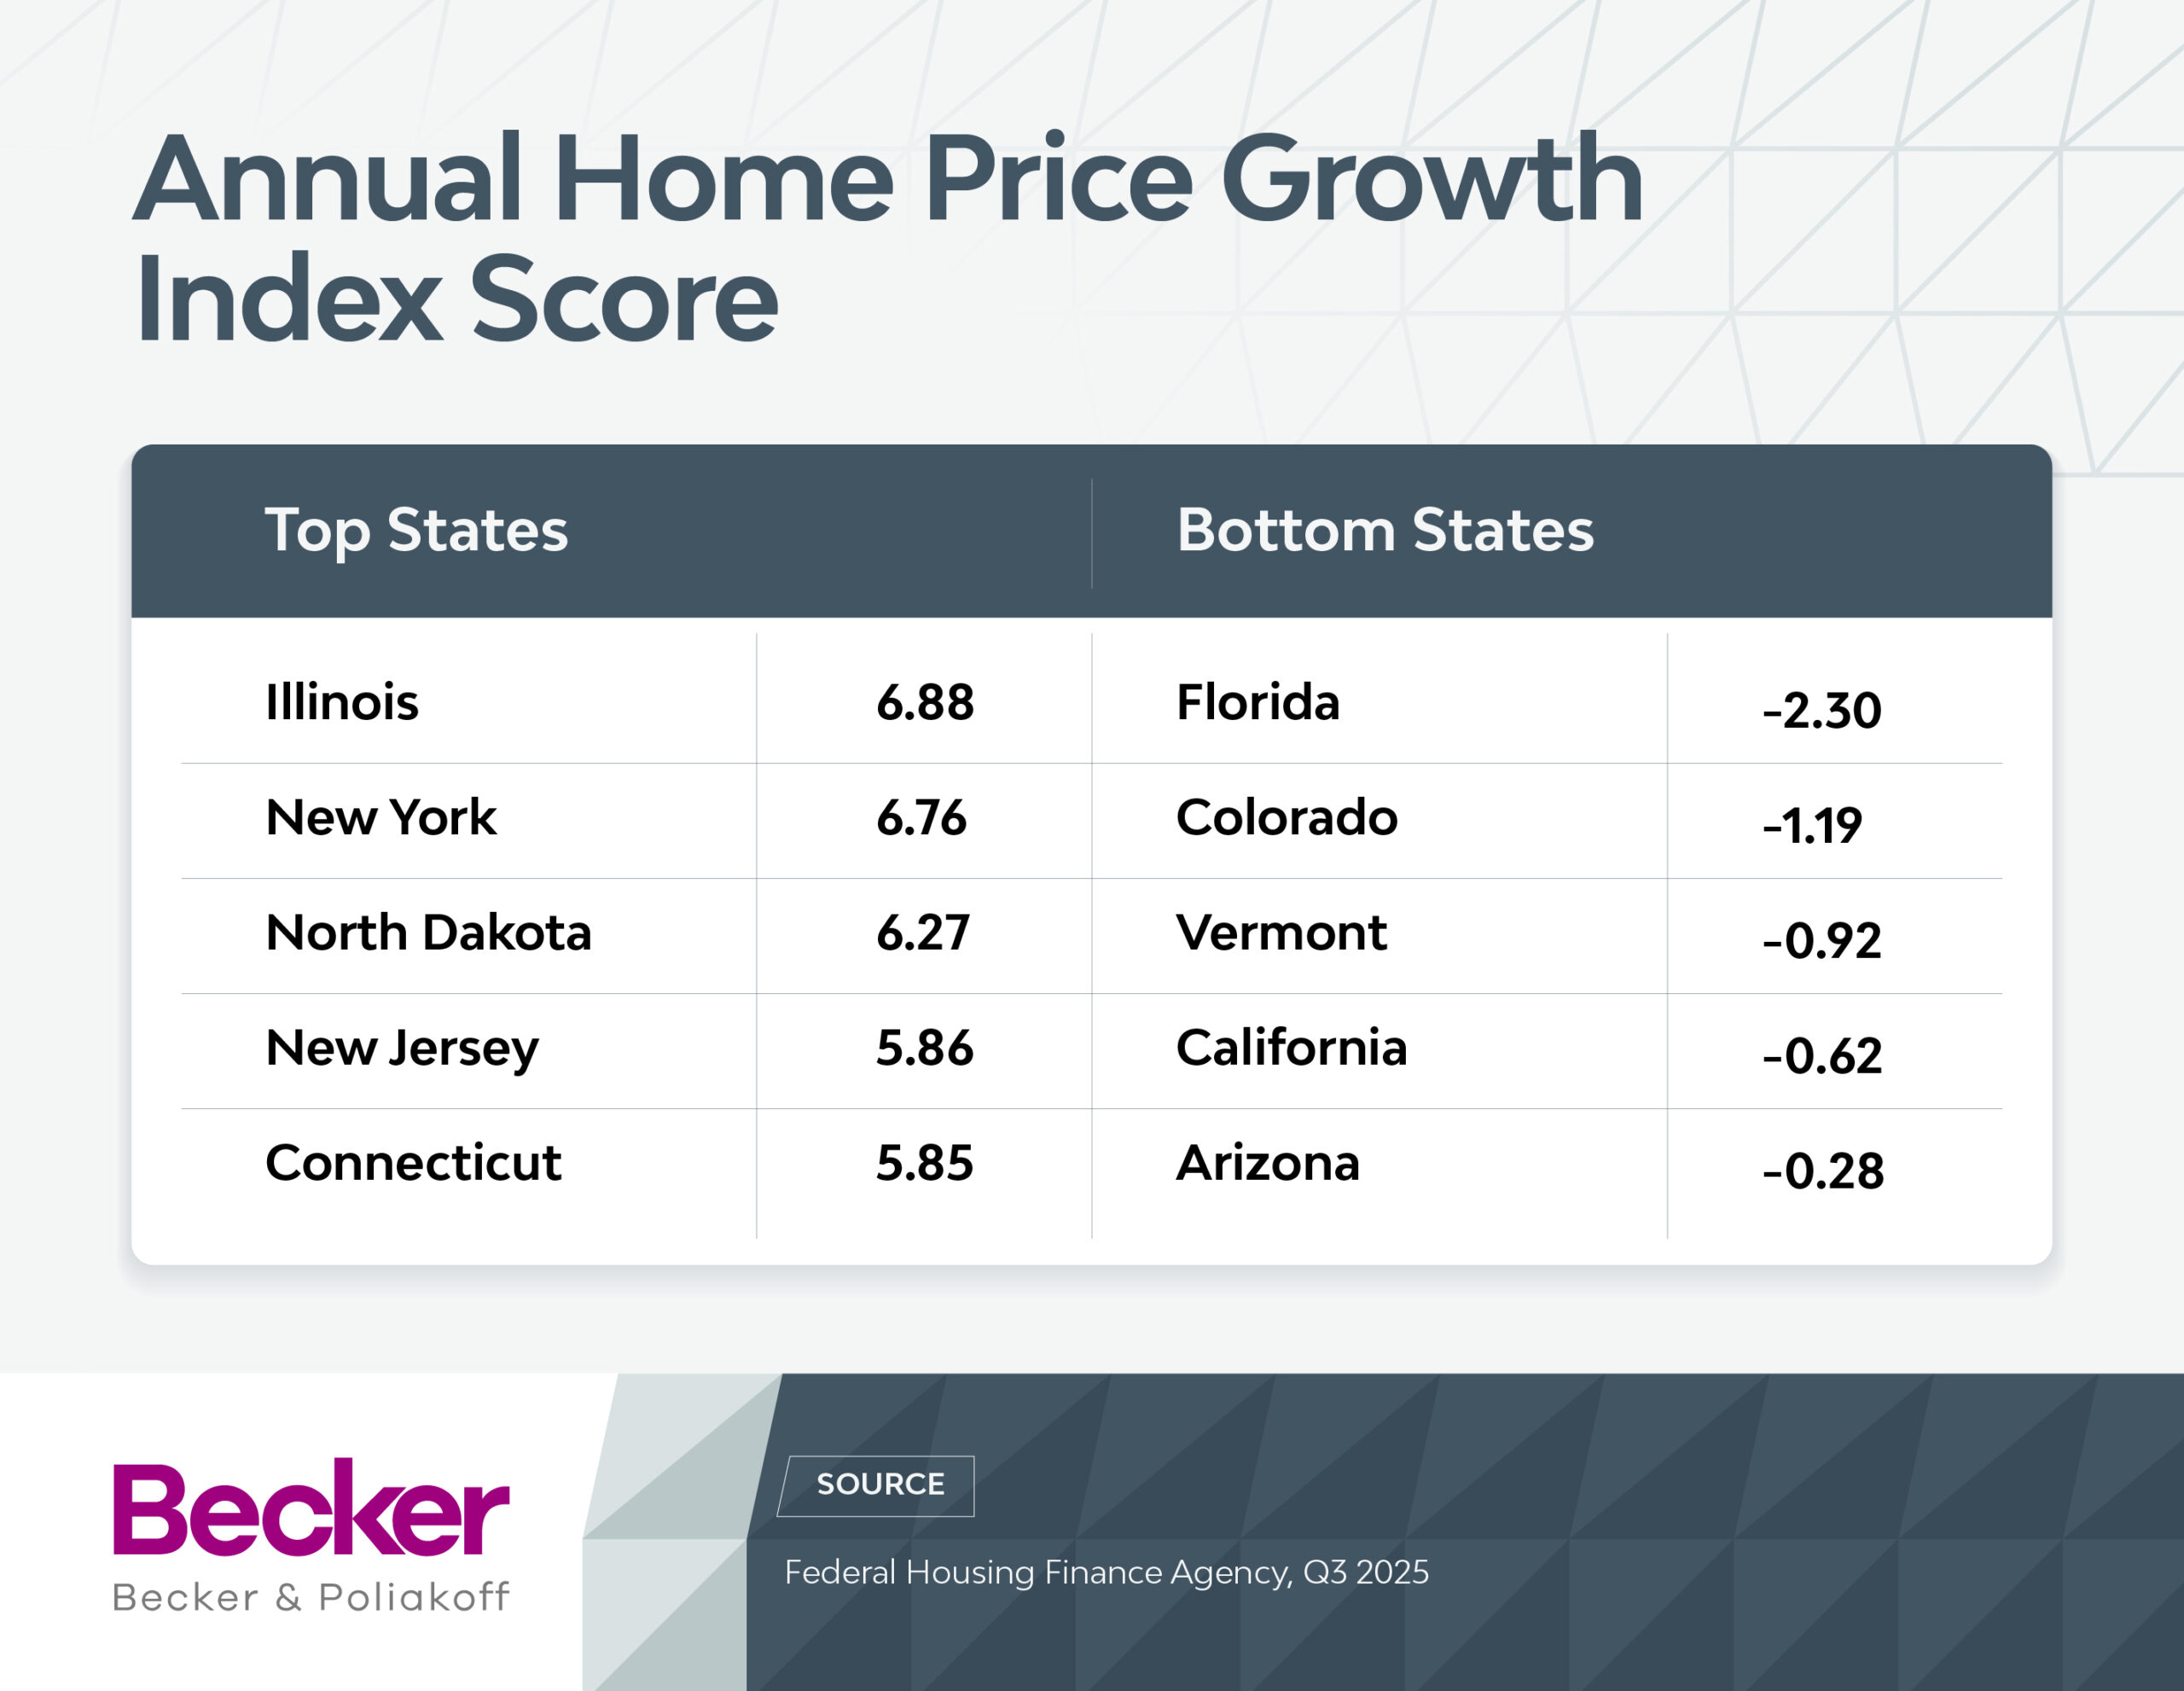
Home Price Growth: Higher is better because it signals faster home price appreciation and a strengthening housing market.
Rent Growth: Higher is better, indicating rising rental demand and stronger income potential for landlords.
New Construction Permits: Higher is better because it reflects strong building activity and confidence in future housing demand.
Rental Vacancy Rate: Lower is better, showing a tighter rental market where units fill quickly, and demand outpaces supply.
Renter Cost Burden: Lower is better because it indicates housing remains more affordable and financially sustainable for renters.
Home Purchase Rate: Higher is better, signaling active buyer demand and a healthy pace of homeownership.
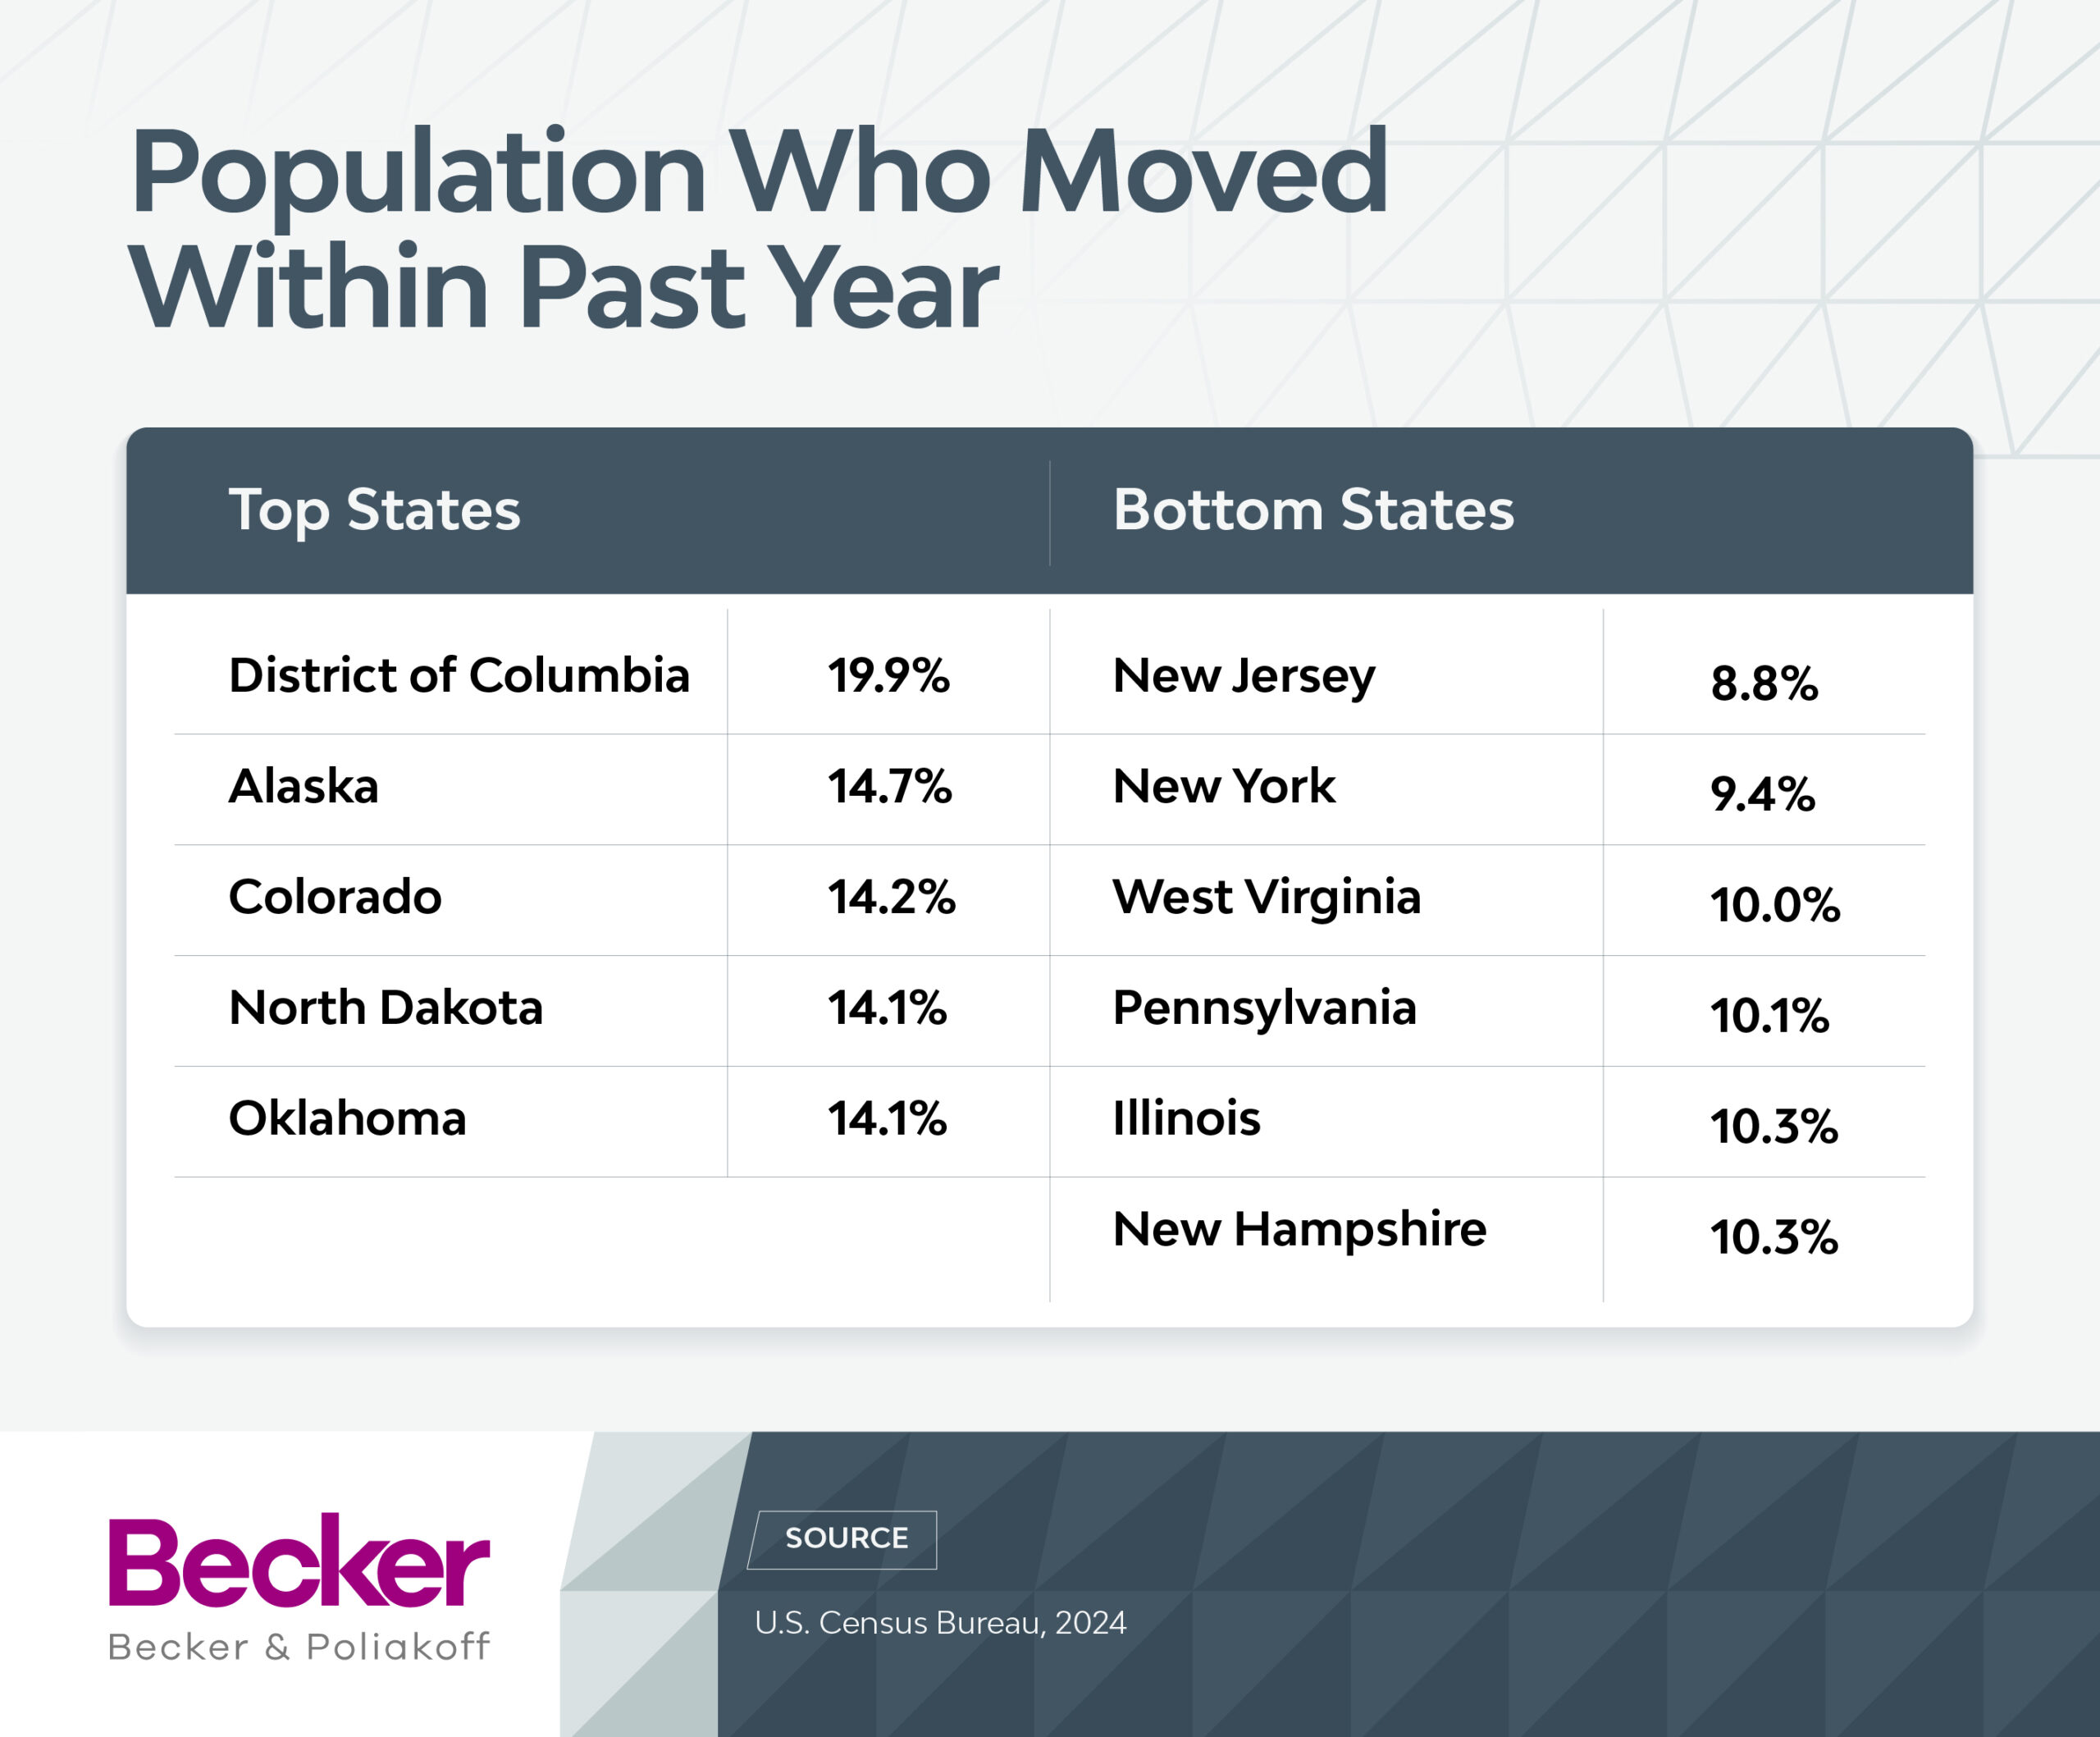
Population Relocation: Higher is better, suggesting strong in-migration and population churn that can fuel housing demand.
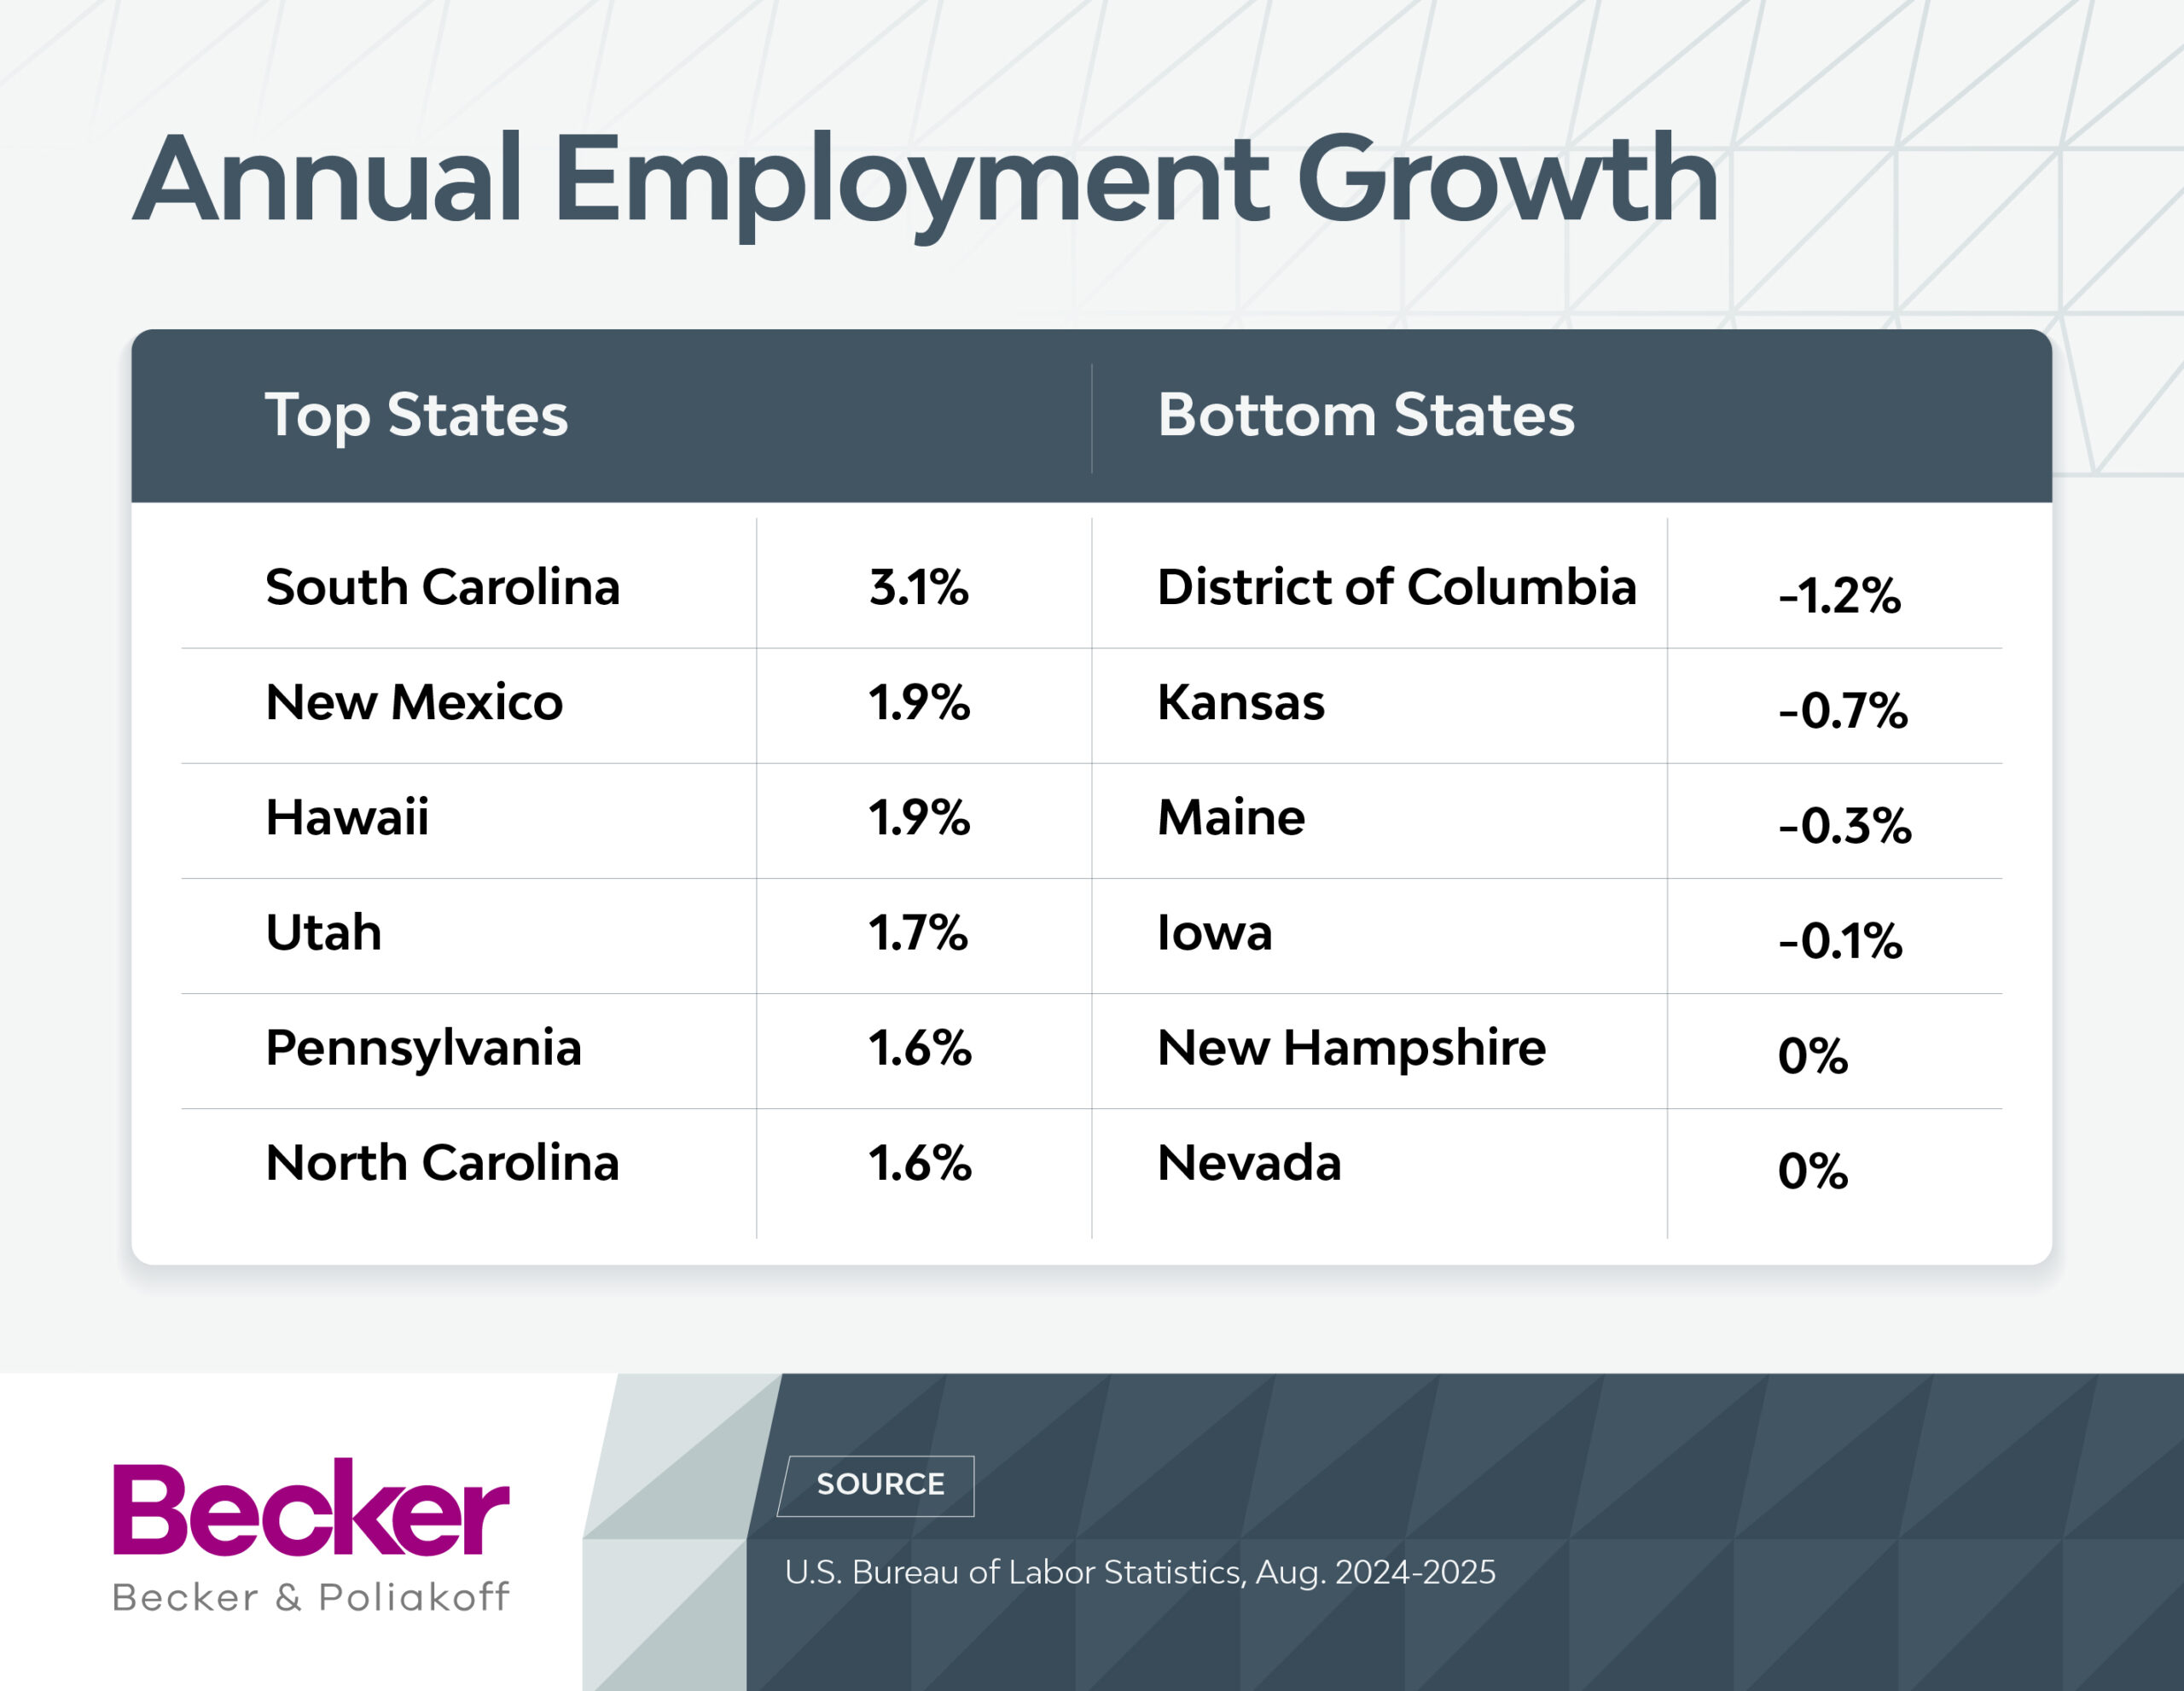
Employment Growth: Higher is better because strong job gains support household formation, income stability, and overall housing demand.
5 Ways to Tell If Your Market Is Heating Up or Cooling Down
- Study seasonal patterns: Prices and competition often ease in winter, giving buyers and renters more negotiating power.
- Check neighborhood-level comps: A market can feel “hot” overall, but nearby blocks may tell a very different story.
- Assess time on market: Homes that sit longer than average can signal softening demand, creating an opportunity to negotiate.
- Talk to multiple local agents: They often spot shifts in buyer traffic or seller incentives before the data does.
- Look for changes in seller behavior: Sudden increases in price cuts, concessions or staged open houses often indicate a cooling market.
Conclusion
Understanding how states stack up across key housing indicators helps reveal where markets are becoming more competitive, more affordable, or more vulnerable. These insights can give renters, buyers, and policymakers alike a clearer view of emerging opportunities and challenges as the housing landscape continues to shift across the U.S.
Methodology
We used the most recent data for eight metrics to determine the states with the hottest and coldest real estate markets. We used a Z-score distribution to scale each metric relative to the mean across all 50 states and Washington, D.C., and capped outliers at +/-3. We multiplied these scores by -1 if it was better to have a lower rate, including rental vacancy and housing cost burden. A state’s overall ranking was calculated by averaging its Z-scores across all available metrics. If data for a particular metric was missing, the state’s ranking was based on the remaining metrics.
Metro area rankings relied on the same data sources – except for home purchases, which were excluded from the metro-level analysis due to a lack of directly comparable data. For the ranking, we included about 300 metro areas with at least five of the seven metrics available. When a metro area spanned multiple states, we counted it in the state where the primary or largest city was located.
Here’s a closer look at the metrics we used:
- Year-over-year home price change index score (Federal Housing Finance Agency, 2025)
- Year-over-year median rent change (U.S. Census Bureau, 2024)
- Building permits per 10,000 residents for new privately owned housing units (U.S. Census Bureau and U.S. Census Building Permits Survey, Sept. 2024-Aug.2025)
- Rental vacancy rate (U.S. Census Bureau, 2024)
- Housing cost burden, or share of renter households spending 30% or more of income on housing (U.S. Census Bureau, 2024)
- Home purchases per 1,000 people, measured by mortgage originations to buy a home (Federal Financial Institutions Examination Council, 2024)
- Population who moved within the past year, either from within the state, out of state or abroad (U.S. Census Bureau, 2024)
- Year-over-year employment growth (U.S. Bureau of Labor Statistics, Aug. 2024-2025)