U.S. Ranks No. 1 in the World Attracting $279 Billion
More Than Double China
Texas Ranks No. 1 Among States Pulling in $22.8 Billion
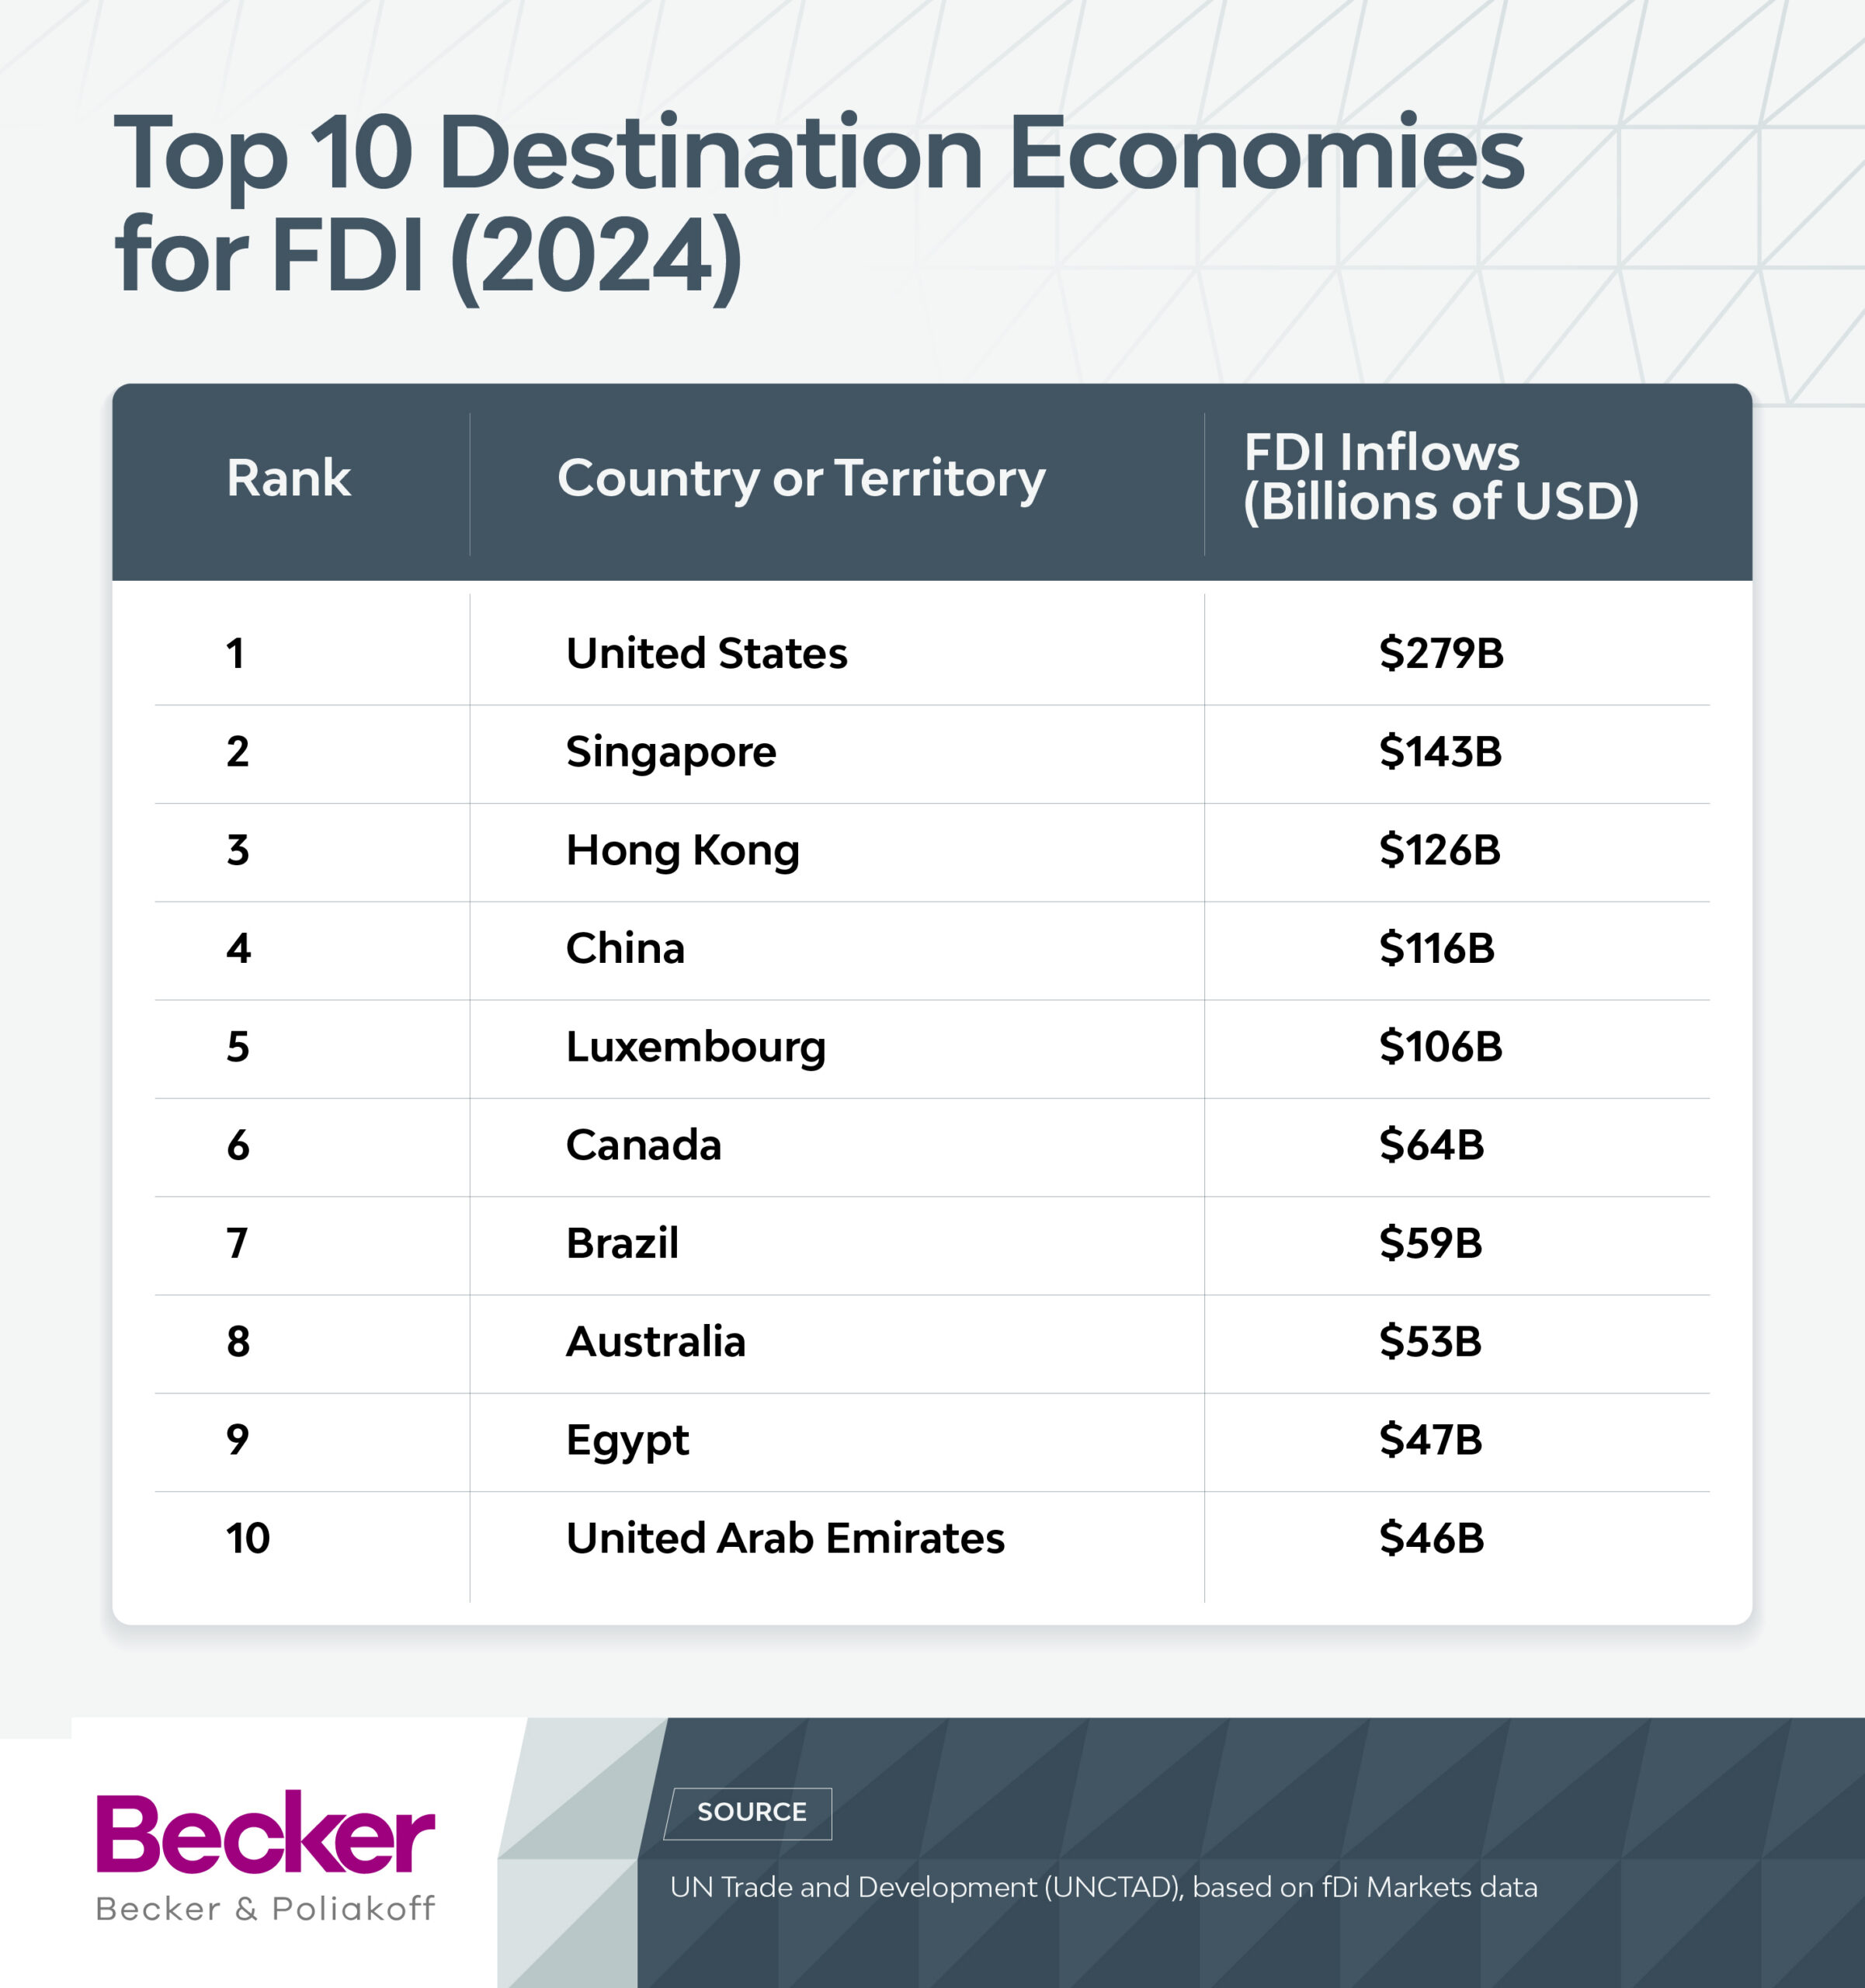
America ranks No. 1 in the world attracting $279 billion in foreign direct investment — more than double China’s $116 billion.
The U.S. received $279 billion in FDI in 2024, the most recent year on record, which is more than the next two top recipients — Singapore and Hong Kong — combined, according to UN Trade and Development (UNCTAD), based on fDi Markets data.
While those U.S. inflows remain below the pandemic-era peak of $386 billion in 2021, America remains the safest bet for investors anywhere in the world — and the importance of this cannot be overstated.
Globally, FDI leadership is a cornerstone of American superpower status. It signals worldwide confidence in the U.S. economy, reinforces dollar dominance, and gives Washington unmatched financial leverage — including the power to impose sanctions and shape global economic conditions.
At home, it fuels manufacturing, technological innovation and job creation. Simply put, where capital flows, power follows — and a U.S. that leads in FDI remains at the center of the global economic order.
Since returning to office, President Trump has announced $18 trillion in new foreign investment commitments to the United States. While the figures are significant, many of the pledges have not yet materialized. The Peterson Institute for International Economics (PIIE) has noted that the announcements span undefined time horizons and, in some cases, “strain credibility.”
To better understand the current impact of FDI in America, Becker & Poliakoff analyzed the most recent federal and state data across seven categories:
- New annual FDI flows in the U.S.
- Top countries engaging in FDI in the U.S.
- Top industries attracting FDI in the U.S.
- New annual FDI flows by state (among ones with available data)
- The number of jobs in each state directly supported by majority foreign-owned affiliates
- Top industries receiving FDI in each state by number of new projects
- Top countries providing FDI in each state by number of new projects
Key Findings
- U.S. Ranks No. 1 in the World for FDI: Attracted $279 billion in 2024, the most recent year on record, which is more than the next two nations — Singapore and Hong Kong — combined
- Texas Leads in New FDI Received: Texas attracted $22.8 billion in new FDI in 2025 — the most of any state for which data is available.
- Georgia Is the Standout Overperformer Ranking No. 2: Georgia ranked No. 2 in new FDI at $16.3 billion, despite being only the eighth most populous state.
- South Carolina Leads on FDI Employment Share: South Carolina ranks No. 1 with 8% of total jobs stemming from majority foreign-owned affiliates.
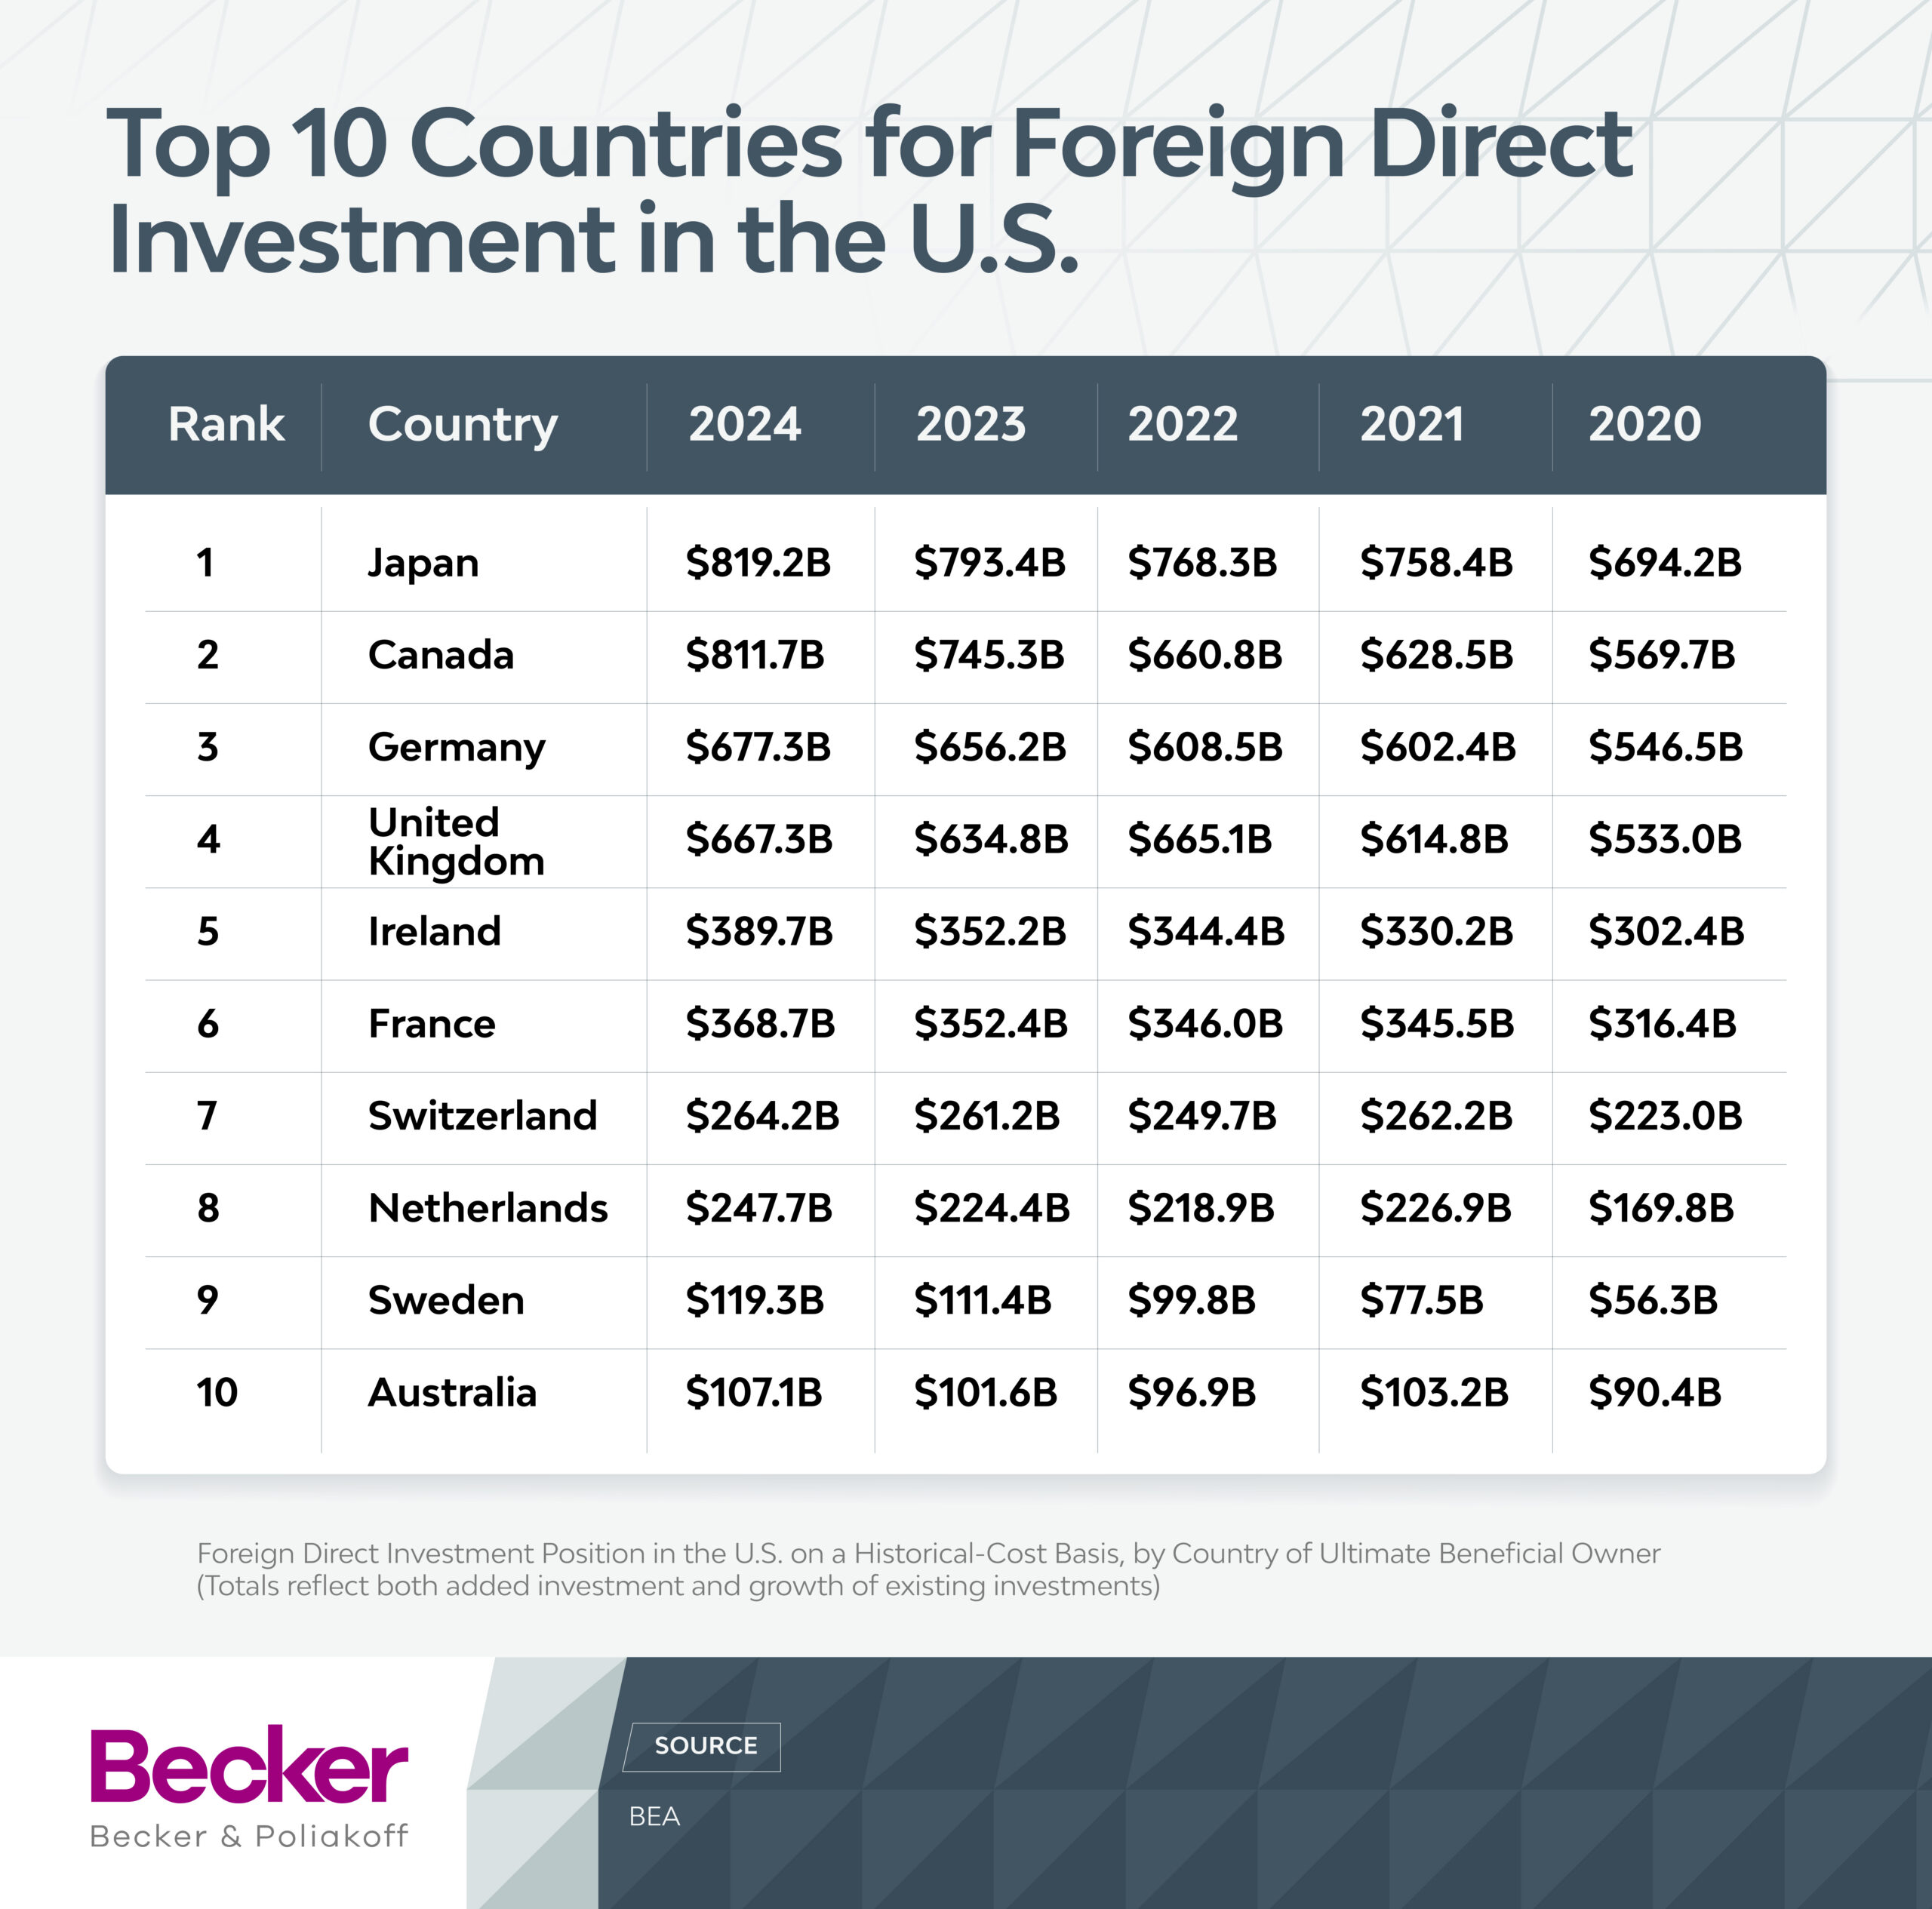
- Japan No. 1 Top Source of FDI in the U.S.: FDI has grown from $694.2B in 2020 to $819.2B in 2024. Canada ranks No. 2 going from $569.7B in 2020 to $811.7B in 2024.
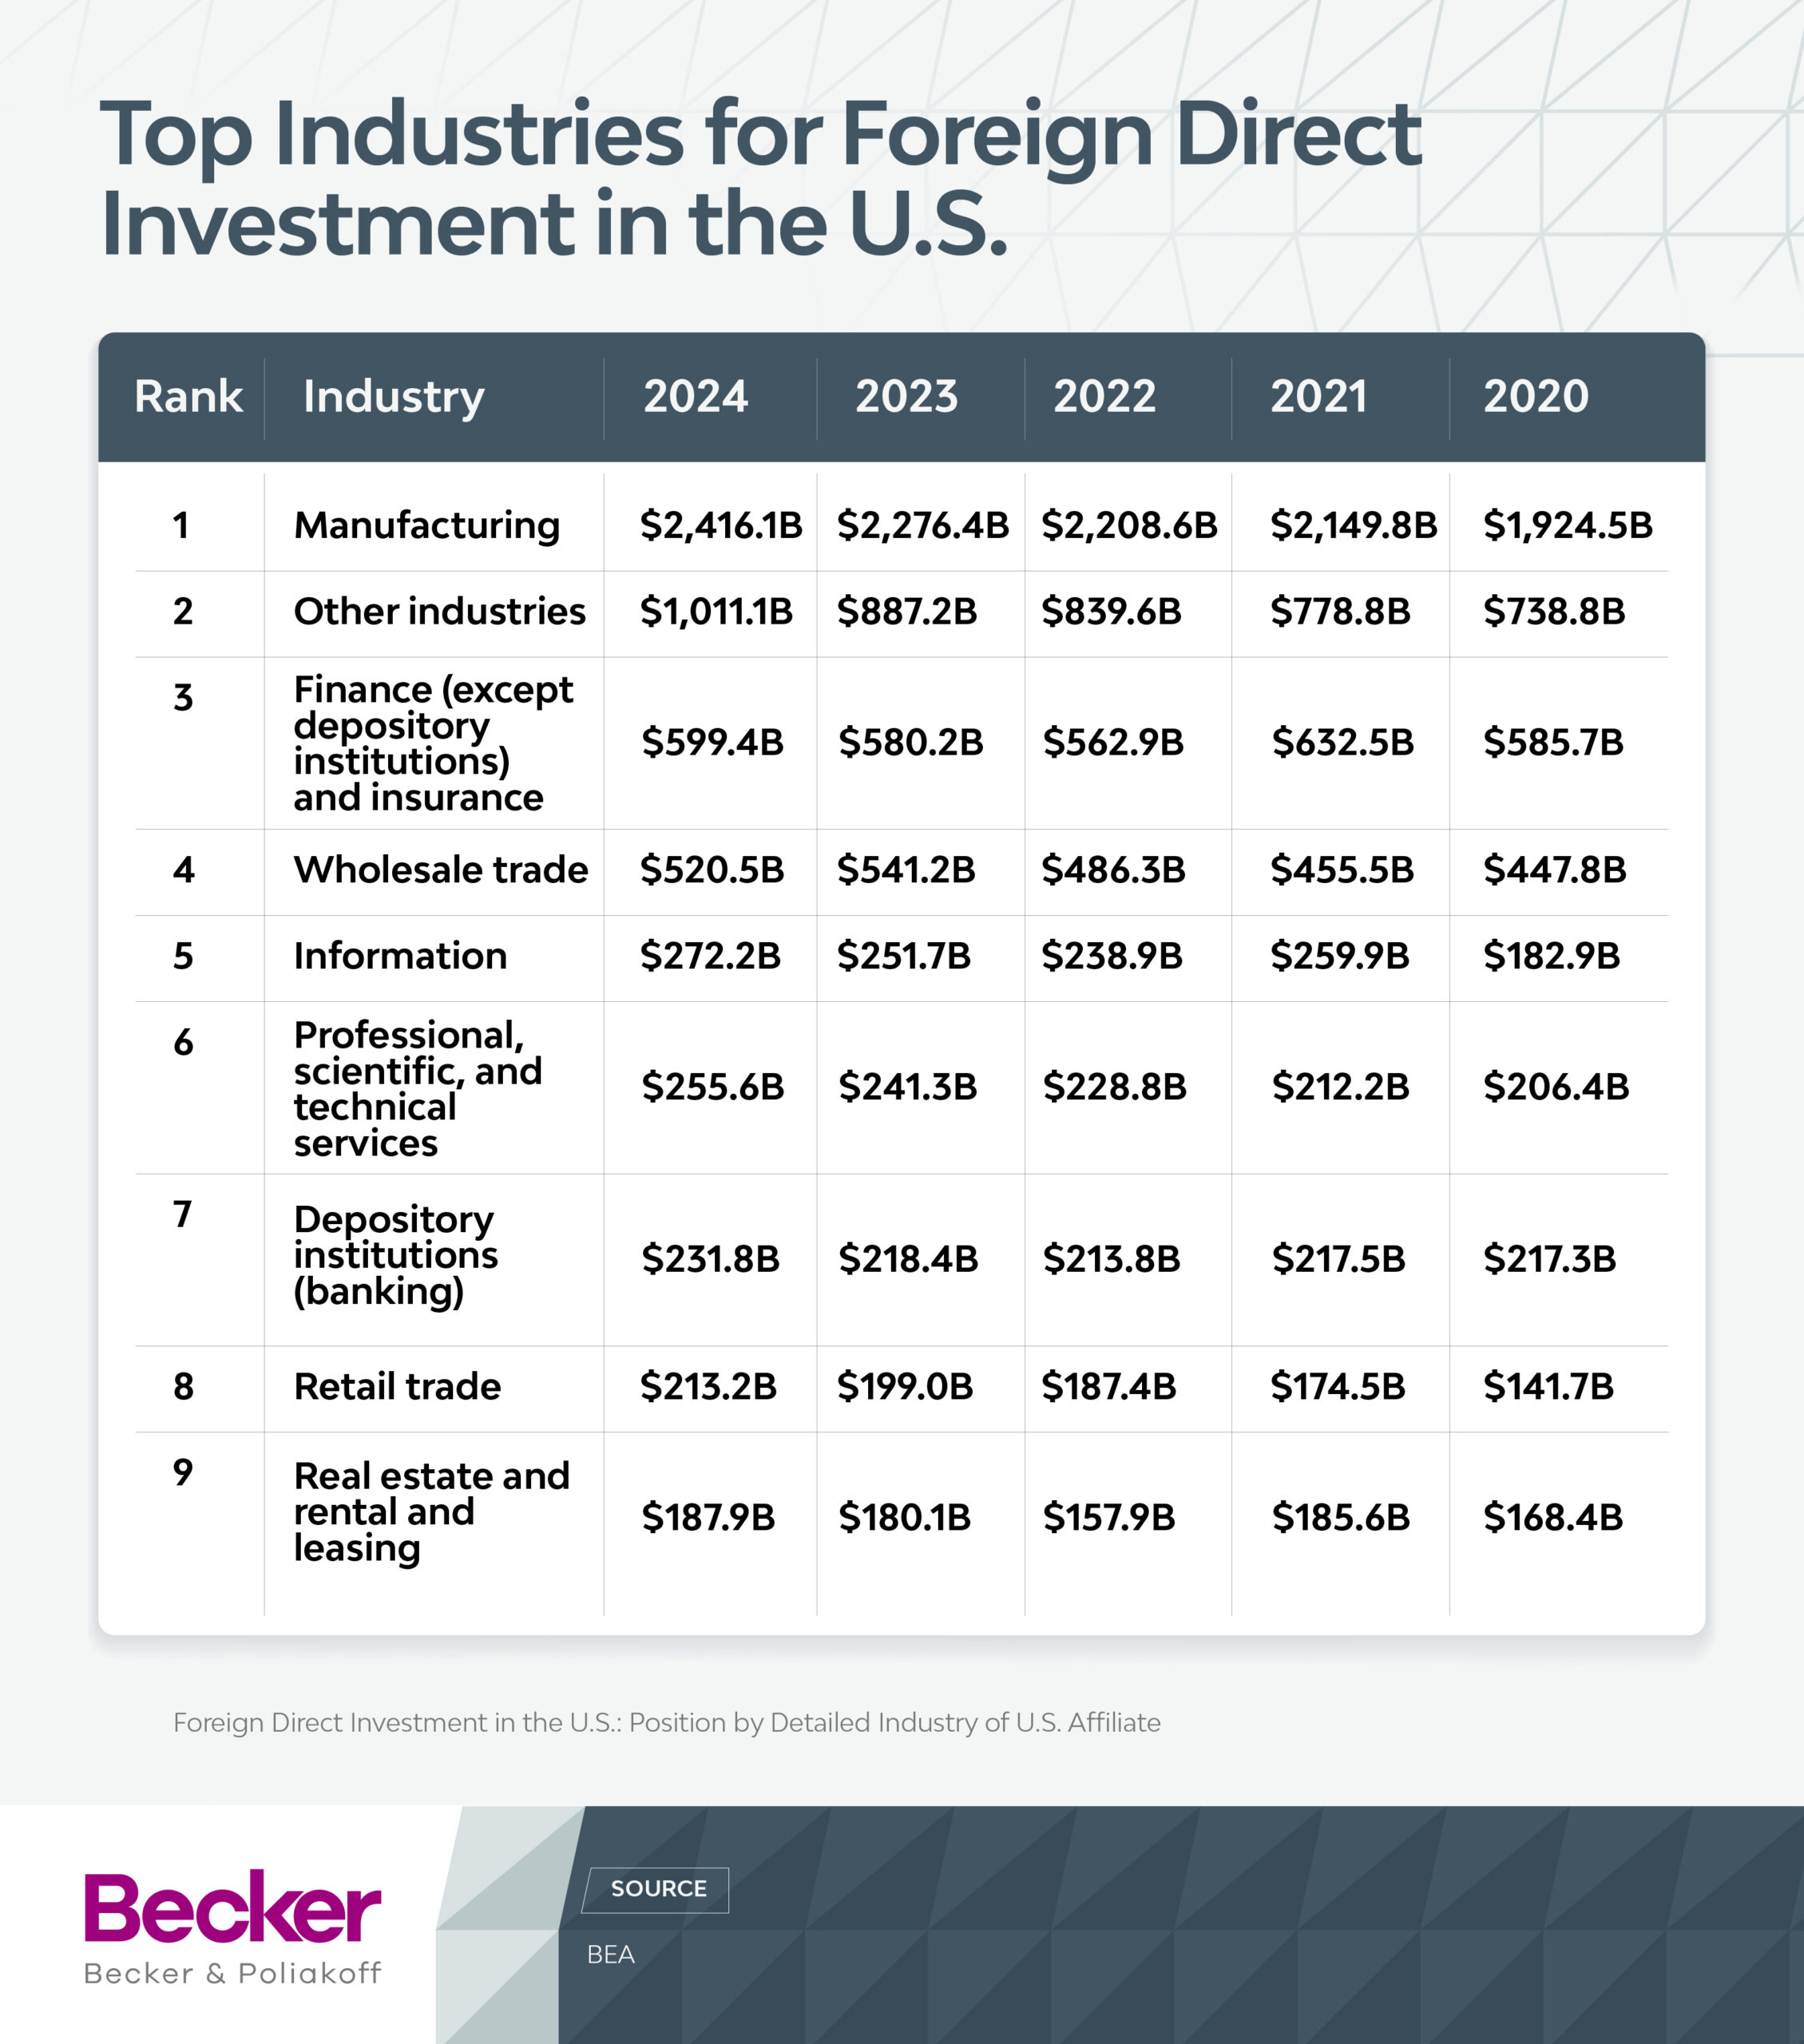
- Manufacturing Attracts the Most FDI in the U.S.: The total position reached $2.4 trillion in 2024, while the next closest category, “Other industries”, only totaled $1 trillion.
Top 10 Countries Investing in U.S.: Japan Ranks No. 1
Most FDI comes from a handful of countries, with Japan retaining its long-running top spot, followed by Canada, Germany, and the United Kingdom, which all have cumulative positions worth over $600 billion. The next closest country in terms of investment position on a historical cost basis (by country of ultimate beneficial owner, since sometimes funds pass through other countries first) is Ireland, at $389.7 billion. And by the 10th spot, Australia’s position measures $107.1 billion.
Keep in mind that while the positions of these top countries have been growing each year, this reflects both new and existing FDI. So, even in years where there’s not as much FDI, a country might have substantial FDI growth based on its existing investments gaining value.
Top Industries Attracting FDI, Manufacturing Ranks No. 1
Manufacturing remains the dominant sector by a wide margin, with a total FDI position of $2.4 trillion in 2024. That’s more than double the next largest category, which is a conglomeration the BEA classifies as “Other industries” ($1 trillion) — which largely includes sectors like transportation and warehousing, mining, utilities, and electric power generation, transmission, and distribution.
After that, finance and insurance — excluding depository institutions — is the next largest, attracting $599.4 billion. That’s followed by wholesale trade ($520.5 billion), and information services ($272.2 billion) to round out the top five.
Top States for New Foreign Direct Investment
Most of the new FDI in the U.S. in 2024, based on the most recent Bureau of Economic Analysis (BEA) data, was concentrated within a small number of states — yet not just the largest ones.
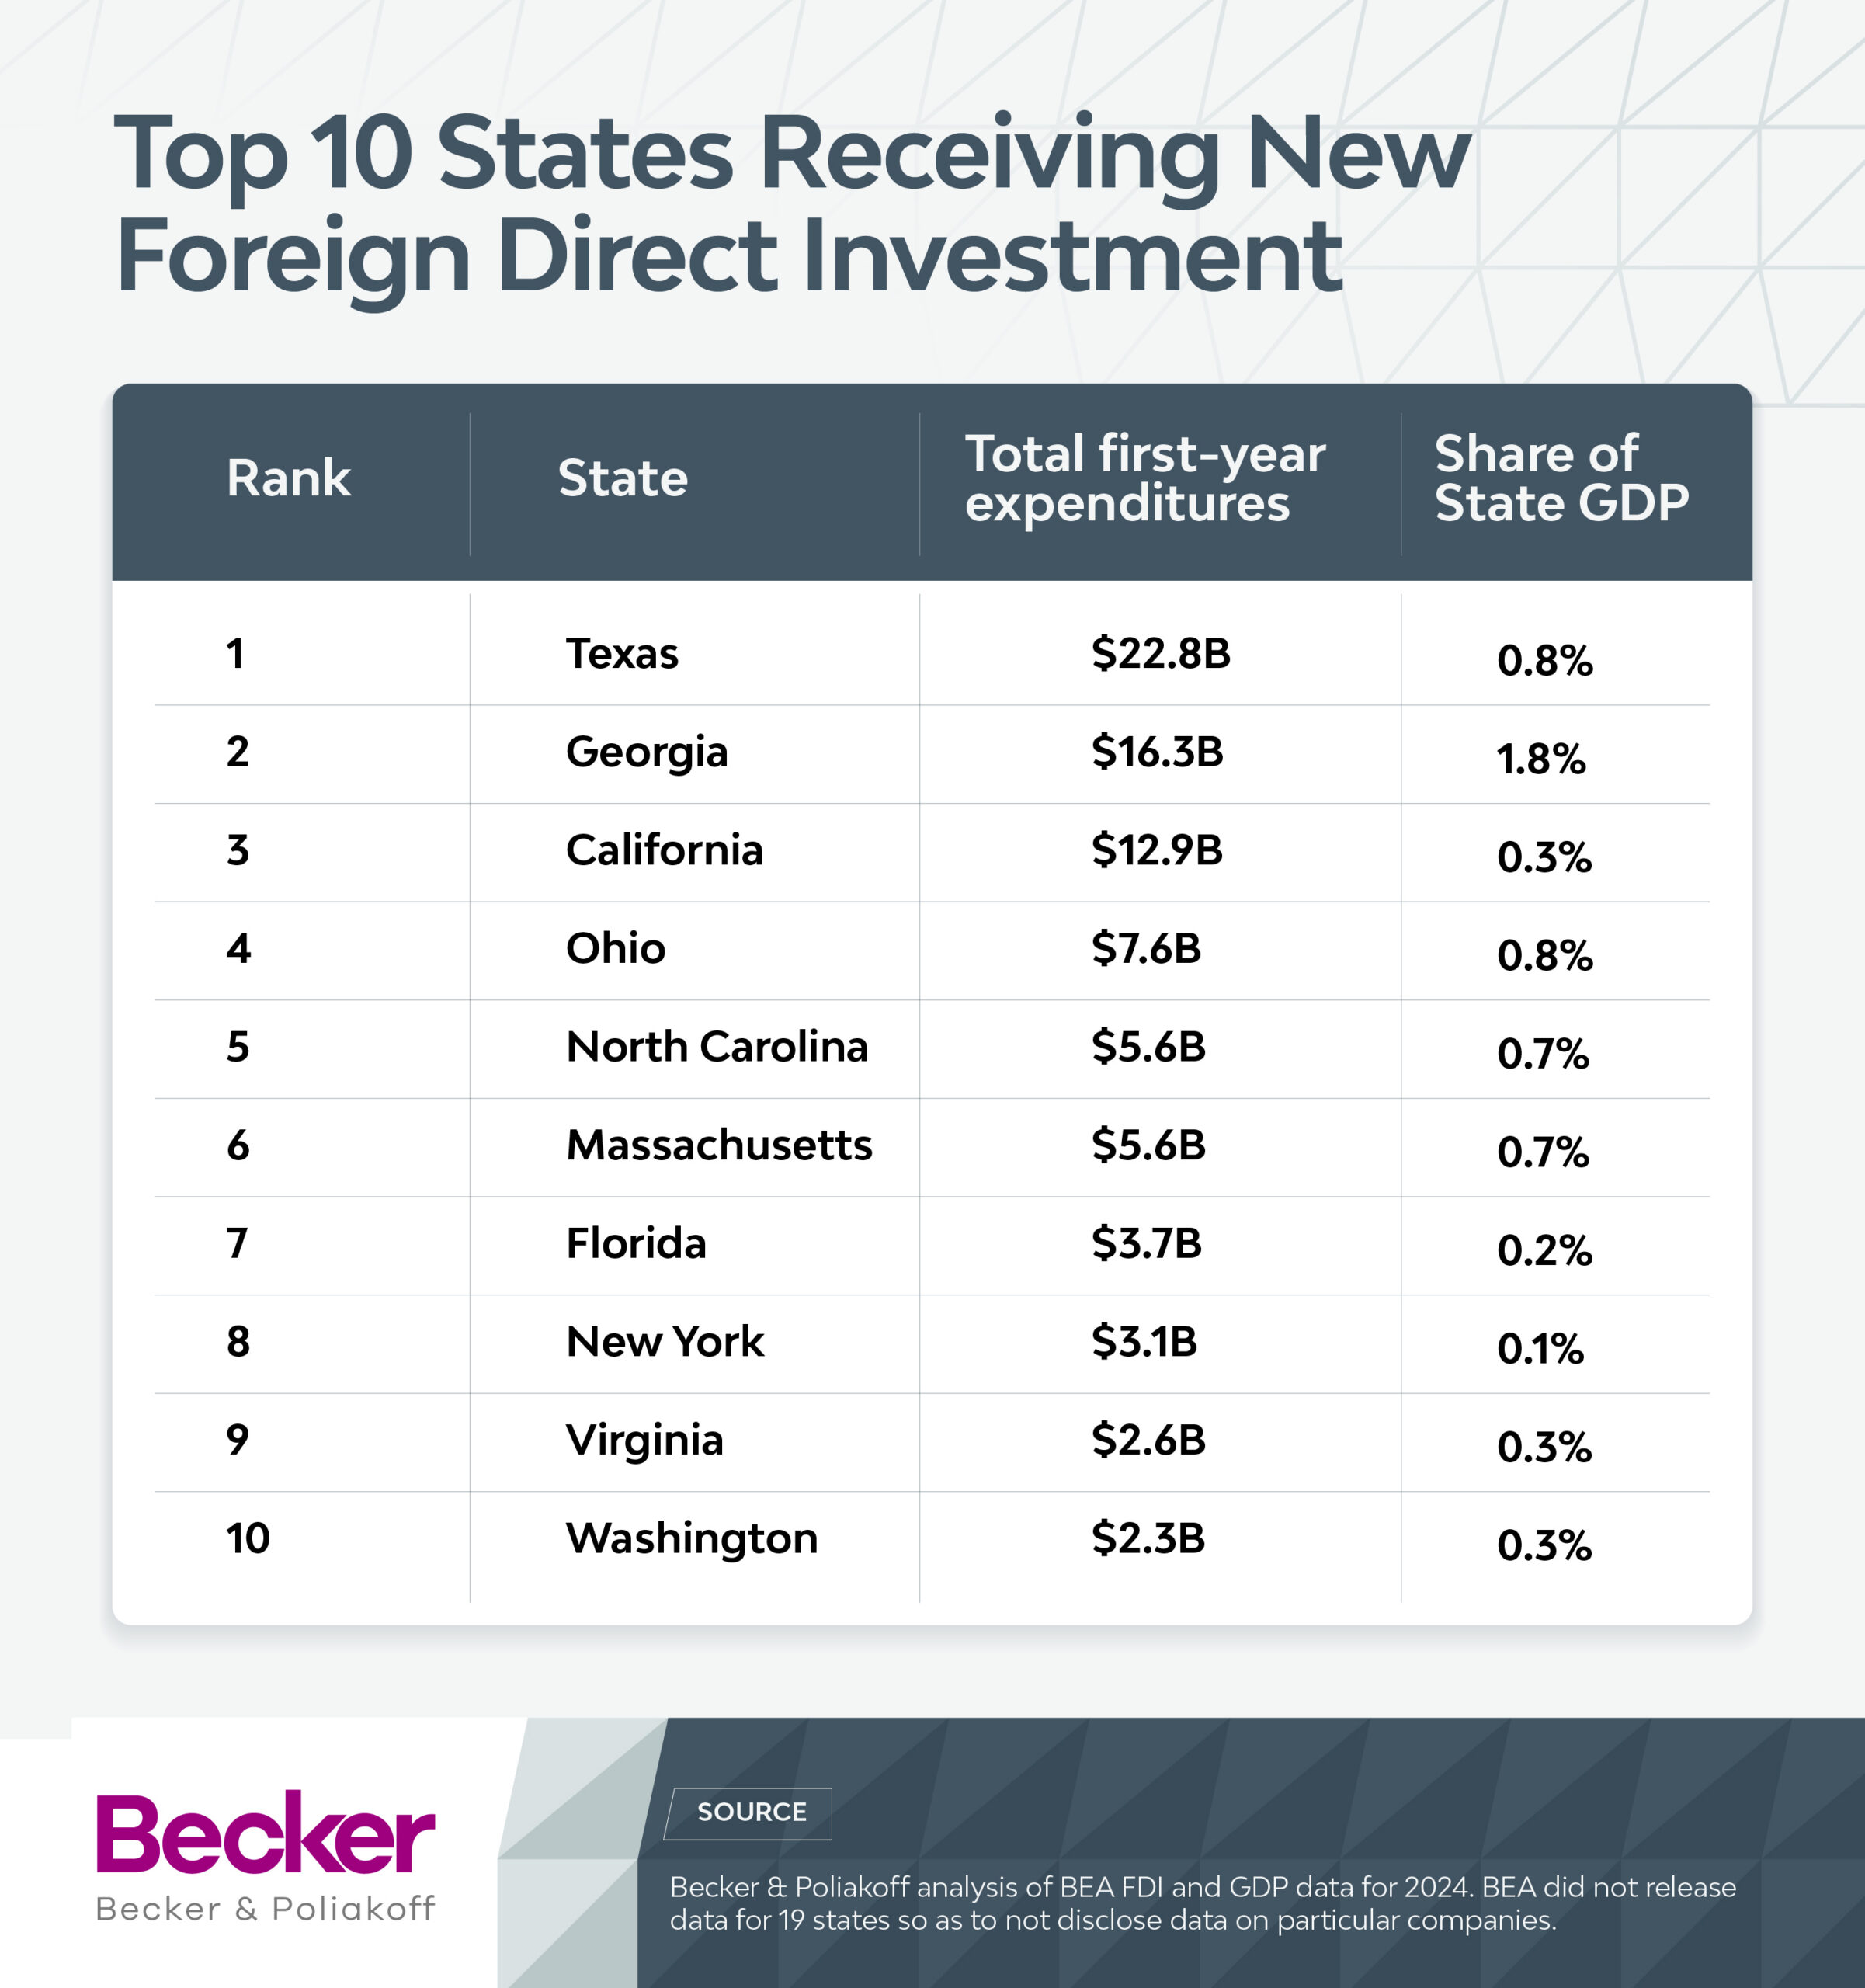
Note that the BEA did not disclose data for 19 states to avoid revealing information about particular companies. While that could mean some of these states still brought in significant FDI, it likely indicates that most or all came from a small number of investors, so that might not be a long-term trend.
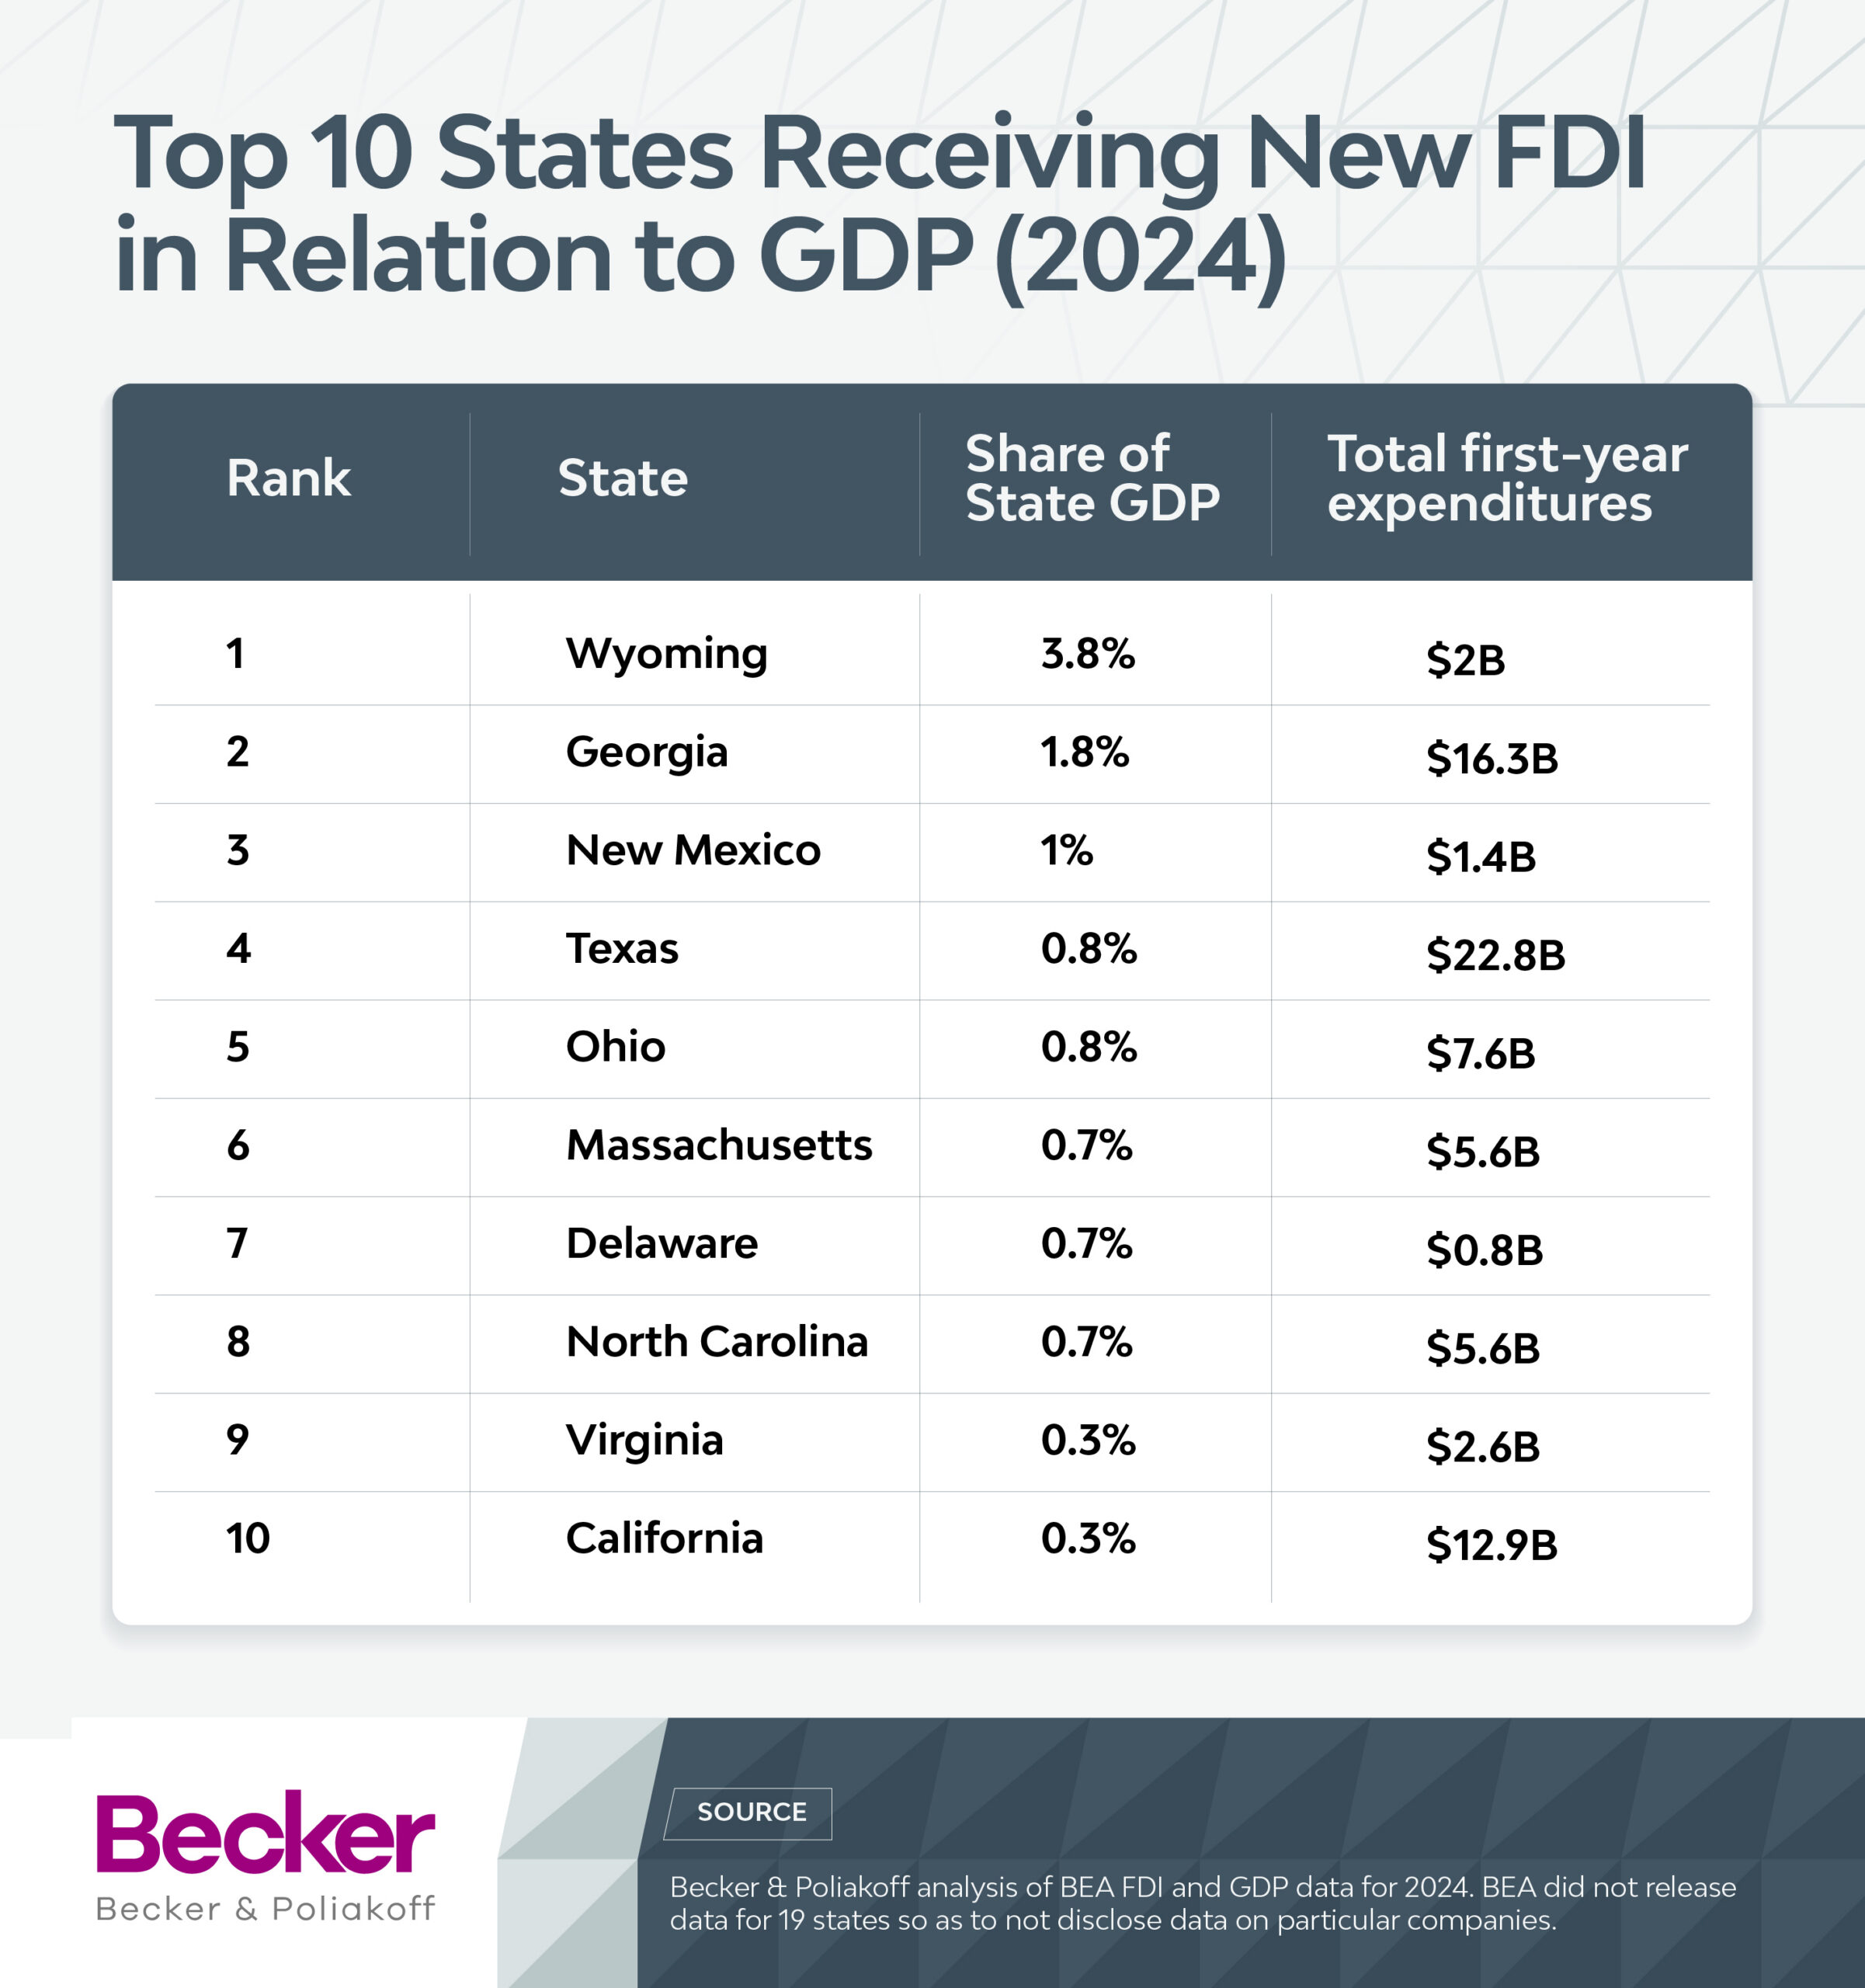
Of the available data, Texas by far leads the way, receiving $22.8 billion in new FDI. As the second most populous state in the country (based on Census data), that might not seem like a huge surprise, but this FDI still equates to a 0.8% share of Texas’ GDP. Keep in mind that foreign investment flows do not necessarily directly contribute to GDP right away, such as if a foreign company purchases an existing asset, but this measure still helps compare FDI flows in proportion to the size of a state’s economy.
Meanwhile, for California, the largest state by population, its $12.9 billion in FDI (3rd overall) only matches 0.3% of the state’s GDP. Meanwhile, Florida, the third most populous state, pulled in $3.7 billion in FDI, which amounts to 0.2% of its GDP.
The major standouts, though, are states like Georgia, Ohio, North Carolina, and Massachusetts, which punch above their weight. Ohio (seventh most populous state) brought in $7.6 billion in new FDI, which ranks 4th and equates to 0.8% of its GDP. The state has been attracting FDI in areas like automotive components and industrial equipment.
Georgia ranks second in new FDI, despite only having the eighth-highest state population. In 2024, Georgia brought in $16.3 billion in FDI, which totaled 1.8% of its GDP. Like Ohio, Georgia has attracted many FDI projects in areas like automotive components and industrial equipment, though there’s also a sizable software/IT industry there attracting FDI.
Only Wyoming had a higher proportion of FDI to GDP. Wyoming attracted $2 billion in FDI (11th overall), which equaled 3.8% of its GDP.
FDI’s Impact on State-Level Employment
For most of those living in states attracting significant FDI, what likely matters most, beyond the investment totals, is the employment impact. While the raw jobs figures largely track with state population data, the share of state employment directly supported by majority foreign-owned affiliates tells a different story. Note that the comparisons between FDI-related jobs and total jobs don’t line up perfectly, given slightly different time periods measured, but analyzing this proportion gives a sense of which states are benefiting most from FDI-related employment.
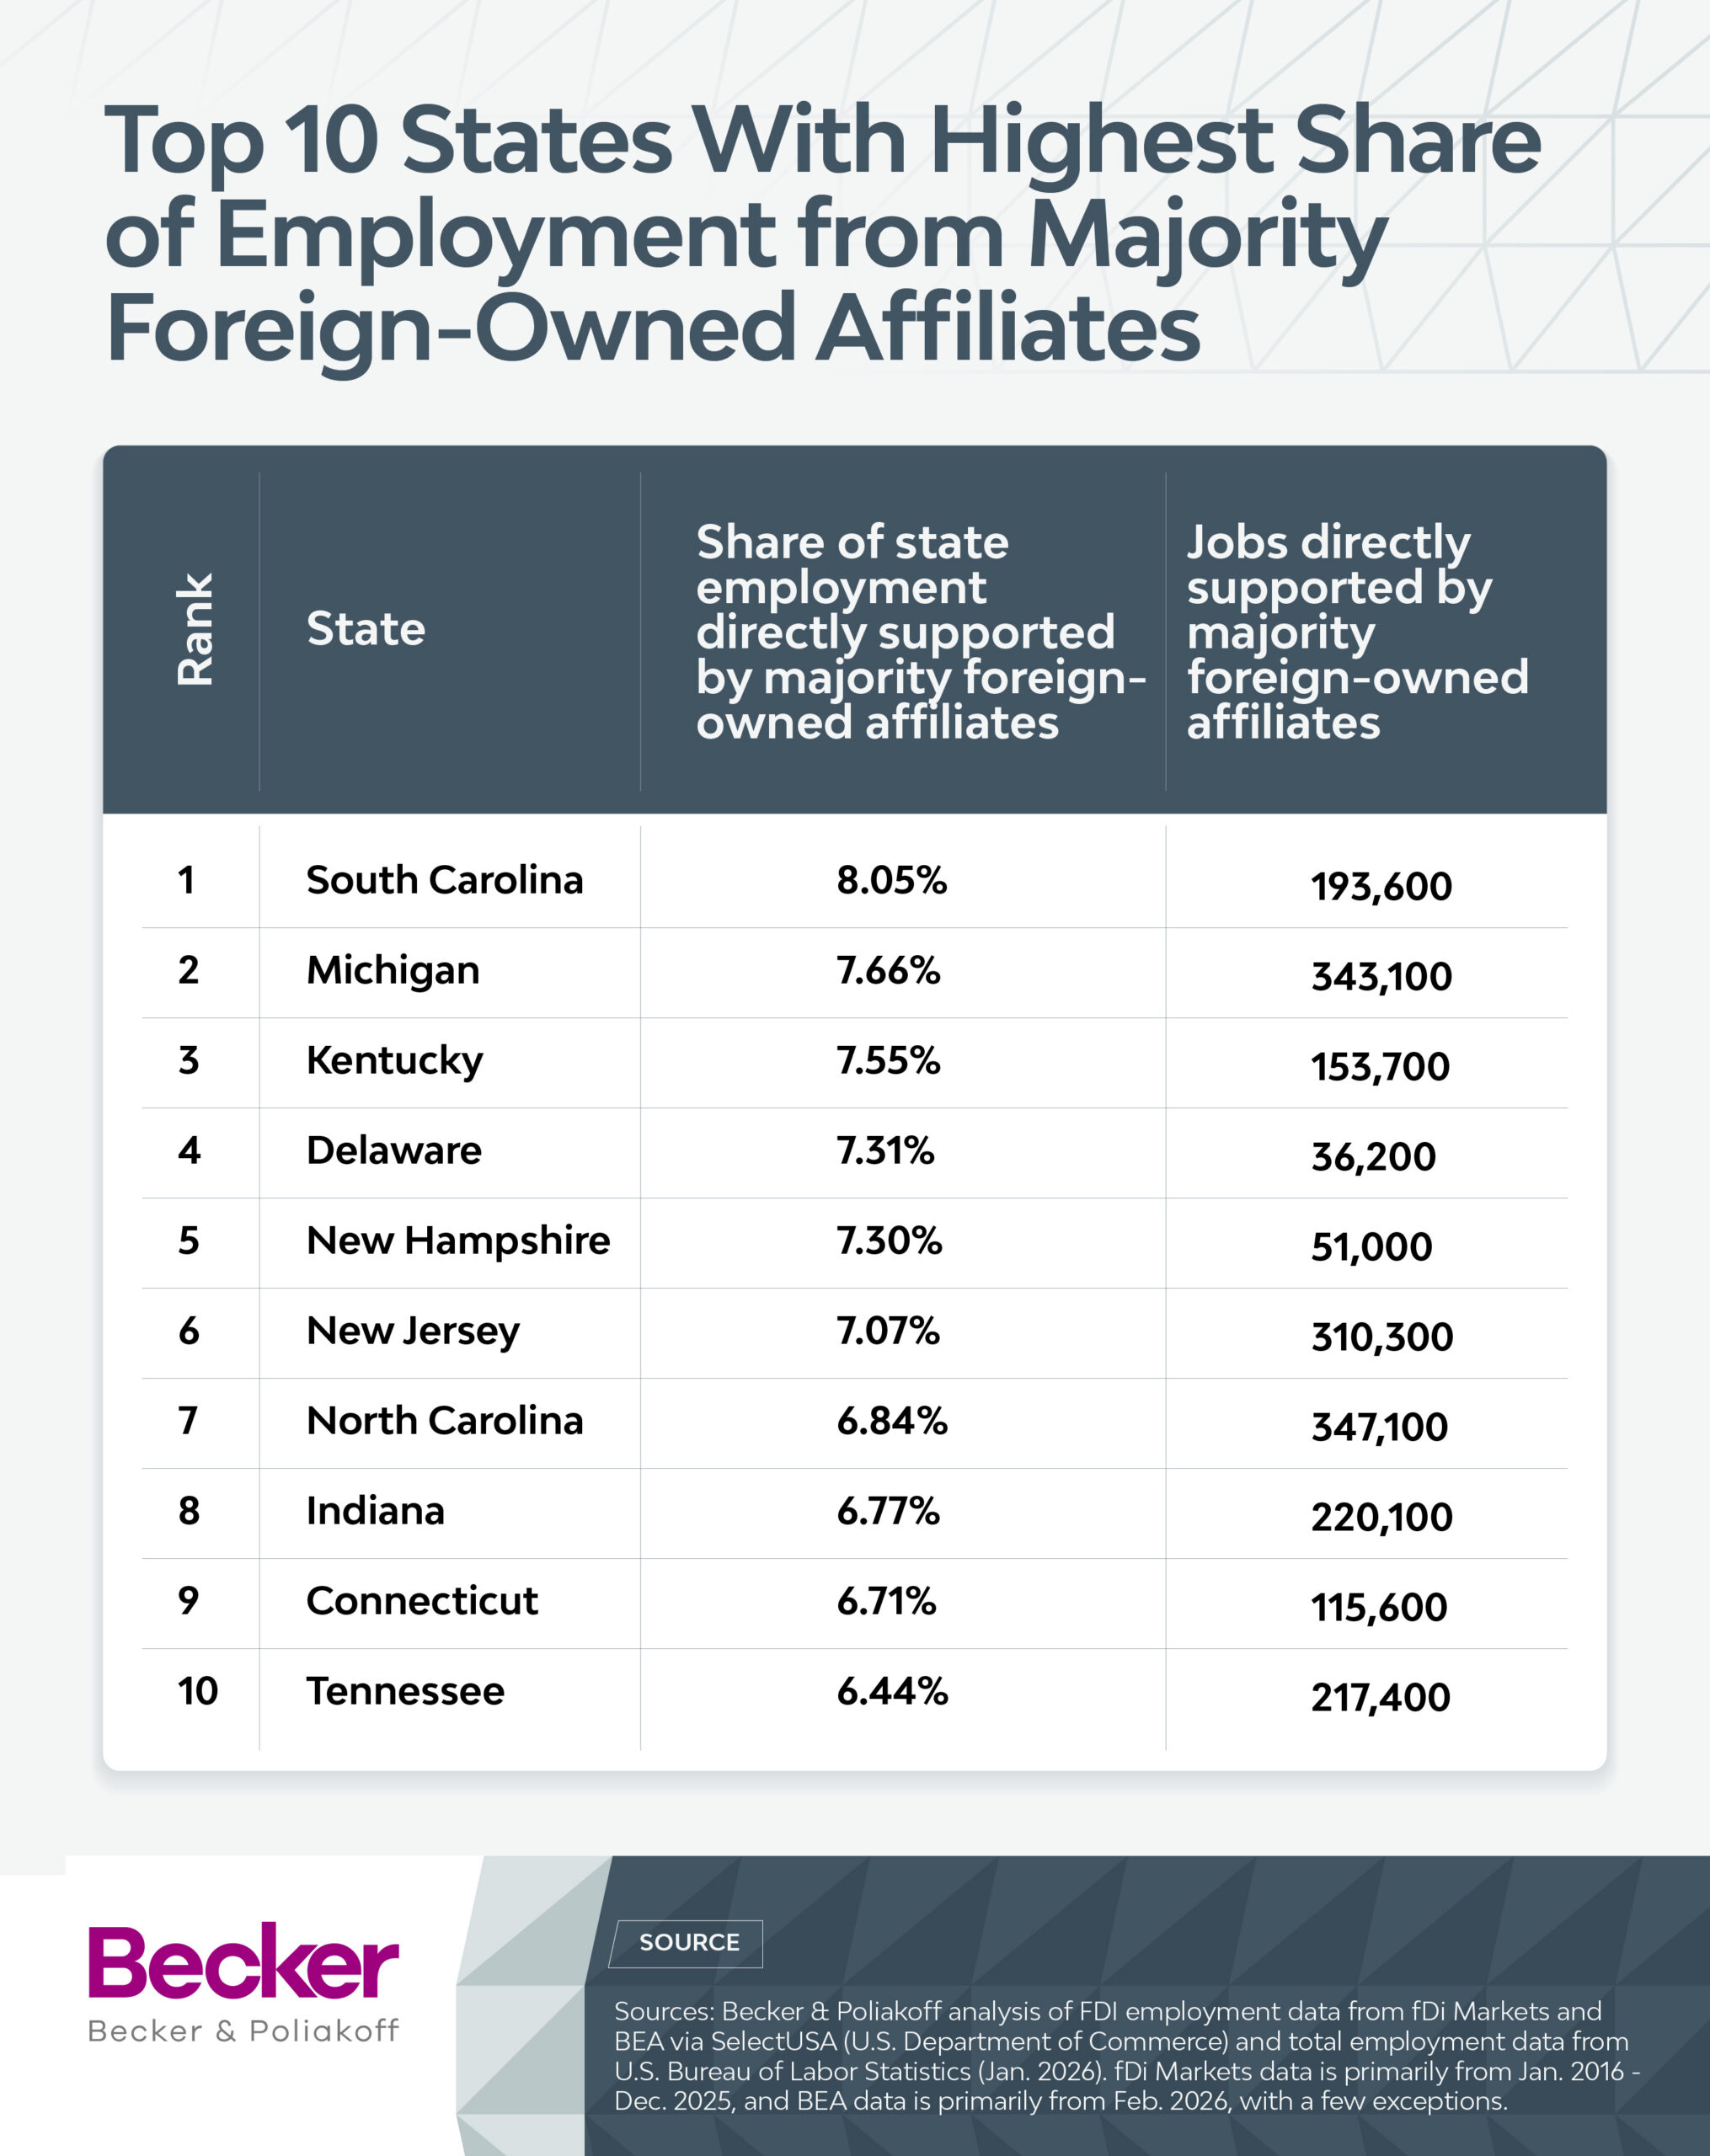
In those terms, South Carolina leads the way, with the 193,600 jobs from majority foreign-owned affiliates equating to 8.05% of its state employment. Some Rust Belt states also pull in significant employment this way, such as Michigan (7.66%, 2nd highest) and Indiana (6.77%, 8th highest).
Several small states also owe much of their employment to majority-owned foreign affiliates, including Kentucky (7.55%, 3rd highest), Delaware (7.31%, 4th highest), New Hampshire (7.30%, 5th highest), and Connecticut (6.71%, 9th highest).
Interactive Map: Click to View State-Level Data
Click on each state to view local data.
5 Factors That Drive FDI to Certain States
Aside from investment simply flowing to states with large economies, there are several factors that tend to coincide with more FDI. For states that aren’t attracting as much FDI as they’d like, focusing on improving these areas could help:
- Infrastructure and logistics access. Large FDI projects, especially in areas like manufacturing, tend to require strong supporting infrastructure and logistics, e.g., easy access to ports, rail networks, and major airports for receiving supplies and shipping goods. States like Georgia have benefited from infrastructure development like upgrades to the Port of Savannah, while having one of the world’s largest airports in Atlanta.
- Workforce skill and affordability balance. To make foreign investment worthwhile, businesses typically prioritize states with skilled but competitively priced labor markets. States like South Carolina and Kentucky have invested in workforce training to build a manufacturing talent pool, while having relatively low costs of living that keep costs down.
- Tax and regulatory environment. States with low corporate taxes and easy-to-navigate regulatory frameworks also tend to attract FDI. However, this isn’t strictly a red vs. blue state dynamic. A high-tax state like Massachusetts, for example, still attracts significant FDI, in part by having a strong regulatory environment that balances building an educated, empowered workforce with attracting stable employers in areas like life sciences and technology. Instead of having an absence of regulation, Cambridge and several other cities in Massachusetts passed biotech safety rules in the 1970s that gave the industry confidence that it could have a long-term home there.
- Proximity to industry clusters. Another proven factor for attracting FDI is having an existing industry cluster that naturally begets more development. The car industry is a clear example of this, where hubs in the Midwest and Southeast continue to attract foreign investors looking to build out projects like EV battery hubs. Texas has also expanded beyond its energy roots to become a major tech hub, which is reflected in its mix of attracting industrial equipment, energy, and software/IT investors.
- State-level investment in FDI outreach. Beyond investing in their own workforce development, states with active economic development agencies can often boost their odds of pulling in FDI. These agencies that can maintain relationships with foreign governments and companies — such as to offer site-selection support and provide targeted tax or other financial incentives — can win out over competing states or countries.
Conclusion
FDI in the United States isn’t growing at the pace it was around the pandemic era, but that certainly doesn’t mean this activity has dried up. The competition has gotten more intense, however, and most of the capital is flowing to a handful of states, and most of the money is coming from a few countries like Japan and Canada.
For those wanting to attract more FDI, size isn’t the only predictor. States like Georgia and the Carolinas show that having factors like strong infrastructure and a solid workforce can help attract more FDI than the population size might indicate.
Also, states might find that building direct relationships with foreign companies and governments could help bring in more foreign investment, particularly in an era where the national position toward certain foreign countries doesn’t always match certain states’ views. Politics can be left aside, and states can try to capture a larger slice of the FDI pie, even if that pie isn’t expanding as quickly as it once did.
Methodology
This study used the most recent available federal data to analyze FDI activity and employment impacts at the state level. Here’s a closer look at the data we used:
- Global foreign investment flows (UN Trade and Development (UNCTAD), based on fDi Markets data, 2021-2025)
- FDI in the U.S. position by country of ultimate beneficial owner: (U.S. Bureau of Economic Analysis (BEA), historical-cost basis, 2020–2024)
- FDI in the U.S. position by industry of U.S. affiliate (BEA, historical-cost basis, 2020–2024)
- New FDI by state, represented by total first-year expenditures (BEA, 2024 | FDI as a share of GDP was calculated using BEA GDP data for the same year. Note: BEA withheld data for 19 states to avoid disclosing information about individual companies.)
- FDI state-level employment share, represented by jobs directly supported by majority foreign-owned affiliates in proportion to total state jobs (FDI employment based on fDi Markets data (primarily January 2016–December 2025) and BEA data (primarily February 2026), accessed via SelectUSA, U.S. Department of Commerce; total employment data via the U.S. Bureau of Labor Statistics (Jan. 2026).)
- Top industry sectors by state (fDi Markets data (primarily January 2016–December 2025) and BEA data (primarily February 2026), accessed via SelectUSA, U.S. Department of Commerce)
- Top country sources of FDI by state (fDi Markets data (primarily January 2016–December 2025) and BEA data (primarily February 2026), accessed via SelectUSA, U.S. Department of Commerce)